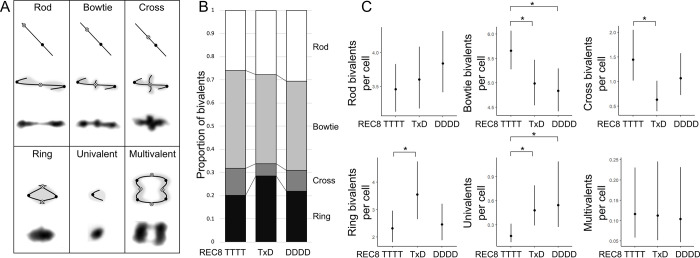
Fig 1. Analysis of REC8 TTTT, TxD and DDDD metaphase I cells.
(A) Key explaining the shapes of different metaphase I chromosomal configurations. Example images of each metaphase configuration (stained with DAPI) are shown (bottom, each box) alongside a stick interpretation, with chromatin shaded in grey (middle) and a cartoon indicating the predicted centromere (black circle) and CO (open circle with cross) position on recombining chromosomes. (B) Stacked bar chart showing the mean proportional frequency of different bivalent shapes in REC8 TTTT, TxD and DDDD metaphase I cells. (C) Plots showing the number of different chromosomal configurations per cell in REC8 TTTT, TxD and DDDD metaphase I cells. Dots indicate trait means and error bars 95% confidence intervals calculated from GLMM models. Significant between genotype p values are indicated: * p < 0.05.

