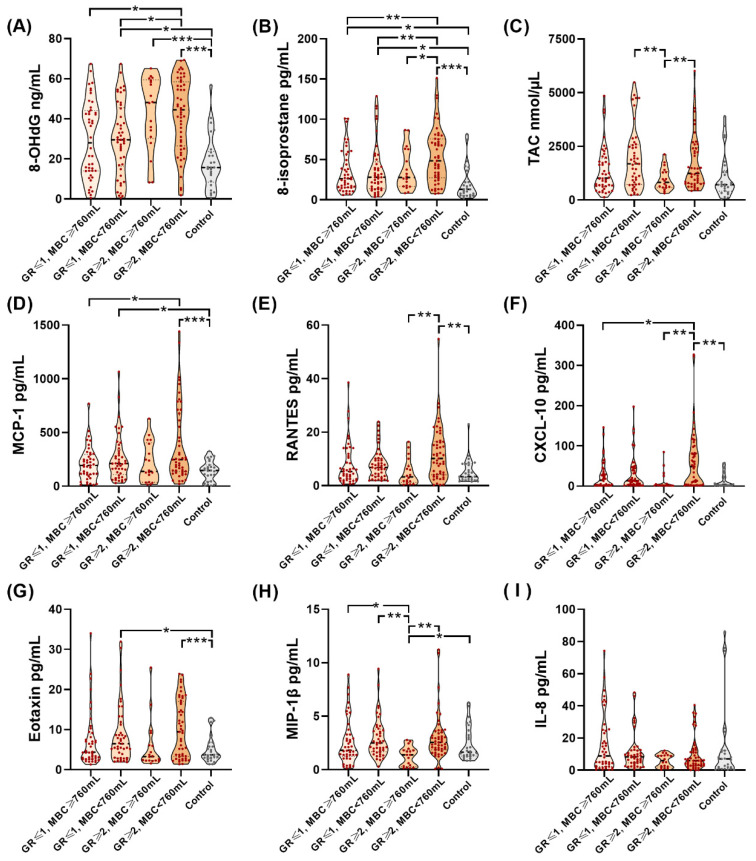
Figure 1.
Violin plots of levels of urine biomarkers among different subgroups of patients with IC/BPS and control patients. Urine levels of (A) 8-OhdG, (B) 8-isoprostane, (C) TAC, (D) MCP-1, (E) RANTES, (F) CXCL-10, (G) Eotaxin, and (H) MIP-1β, but not (I) IL-8 were significantly different among different subgroups of patients with IC/BPS and control patients. *: p-value < 0.05, **: p-value < 0.01, ***: p-value < 0.001.

