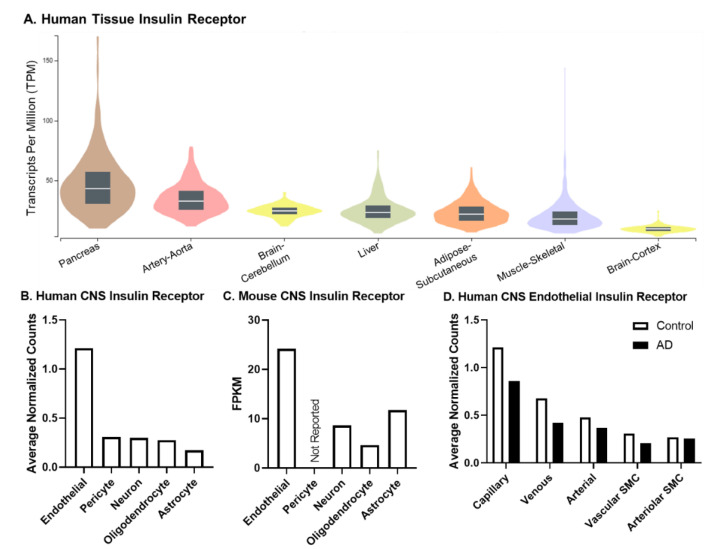
Figure 2.
Expression (mRNA) of the insulin receptor (IR). Existing online, publicly available data resources were used to generate each sub-figure. (A) Expression of IR mRNA in human tissues was organized from the GTEx portal. Box plots are shown as the median, and 25th and 75th percentiles. The sample size range is 226–803. Outliers are not shown. The transcript data is based on the GTEx Analysis Release V8. (B) Human CNS IR data were extracted from the Human BBB Project [47] where the endothelial values shown are from capillary expression, pericytes are from solute transport pericytes, and astrocytes are from the cortex. Tissue samples were taken from post-mortem superior frontal cortex (n = 4) and hippocampus (n = 8–9) and pooled unless otherwise stated. (C) Mouse CNS IR data were extracted from the Brain RNA-Seq data base [48]. Briefly, two biological replicates were used to generate the database (one biological replicate consists of cells purified from 3–12 mouse cerebral cortices) and cell types were purified from different mice. Pericyte data were not shown due to the small contamination of astrocytes and endothelial cells. (D) Human CNS Endothelial IR data were also extracted from the Human BBB project [47]. Only the vascular cell types are shown and levels are compared between controls and AD samples. AD classification was based on a clinical diagnosis. All data were accessed on 4 April 2022.

