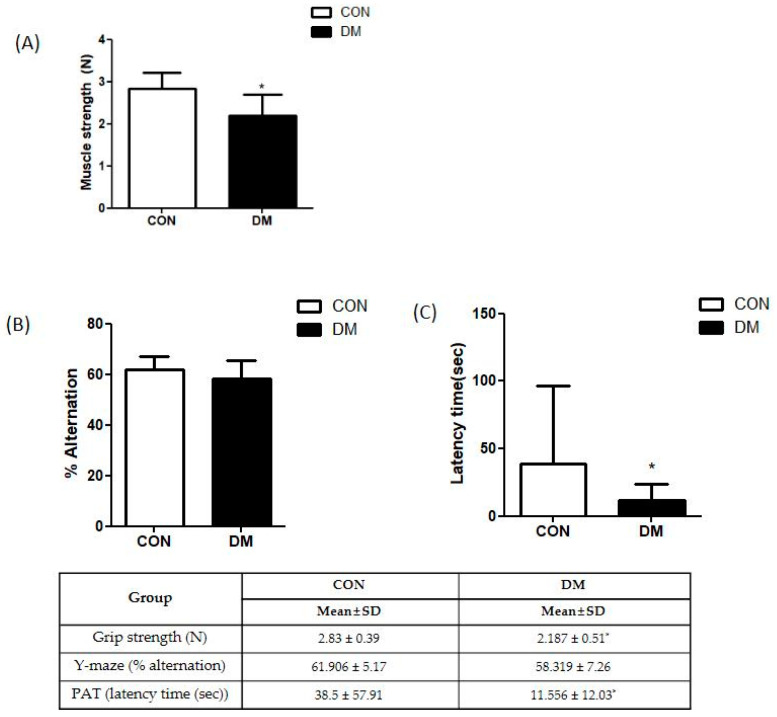
Figure 3.
Behavior test in T2DM mice (A) grip strength test and (B) Y-maze test (C) passive avoidance test All values are reported as mean and SD. The asterisk represents statistical significance of differences from * p < 0.05. n = nine mice in each group. CON, normal control mice; DM, diabetes mellitus mice.

