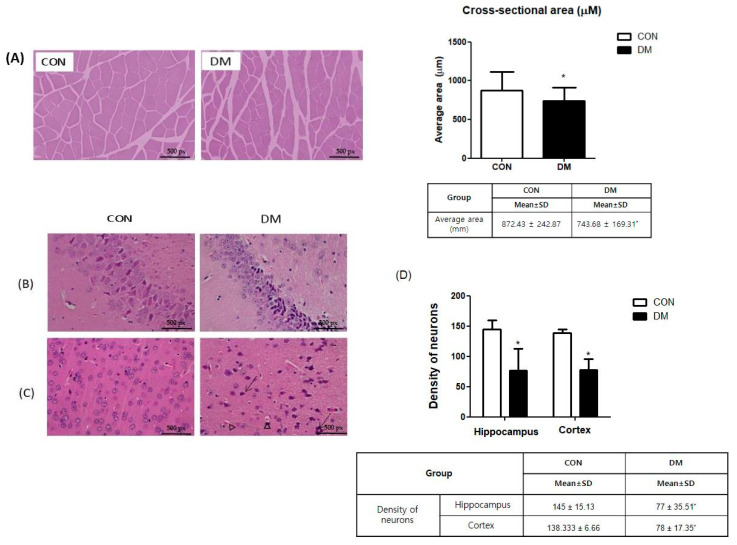
Figure 5.
Morphological changes of (A) skeletal muscle and brain and (B) CA3, (C) cortex, and (D) density of neurons in hippocampus and cortex in T2DM mice (magnification ×200, scale bar = 500 px) Representative photos of skeletal muscle and brain section. Arrows indicate karyopyknosis of cells. Triangles indicate acidophilic necrosis. All values are reported as mean and SD. The asterisk represents statistical significance of differences from * p < 0.05. n = 9 mice in each group. CON, normal control mice; DM, diabetes mellitus mice.

