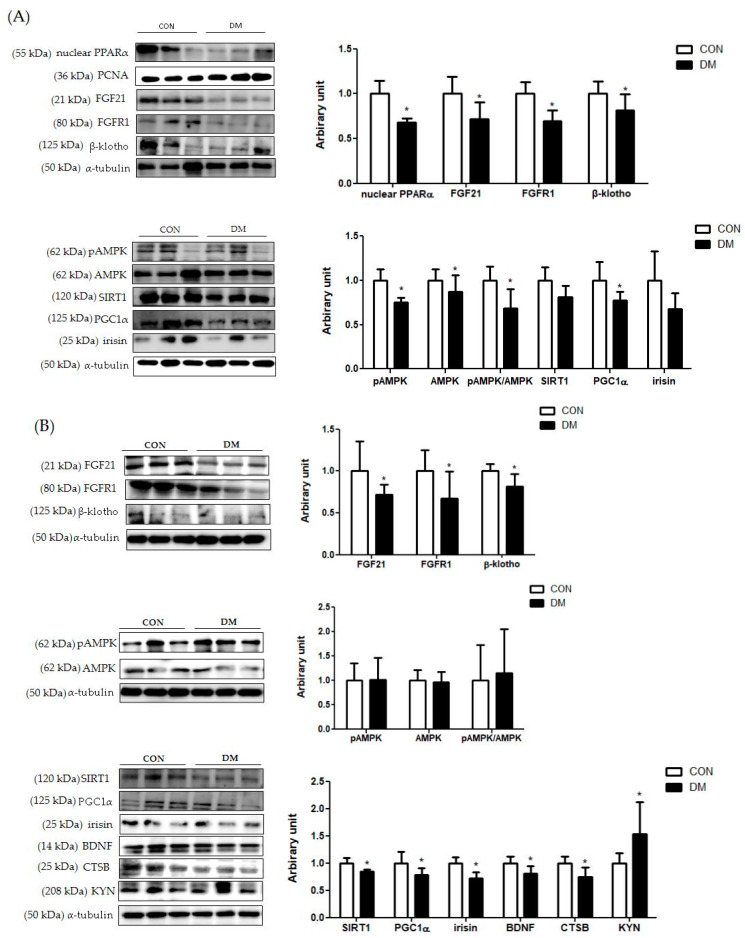
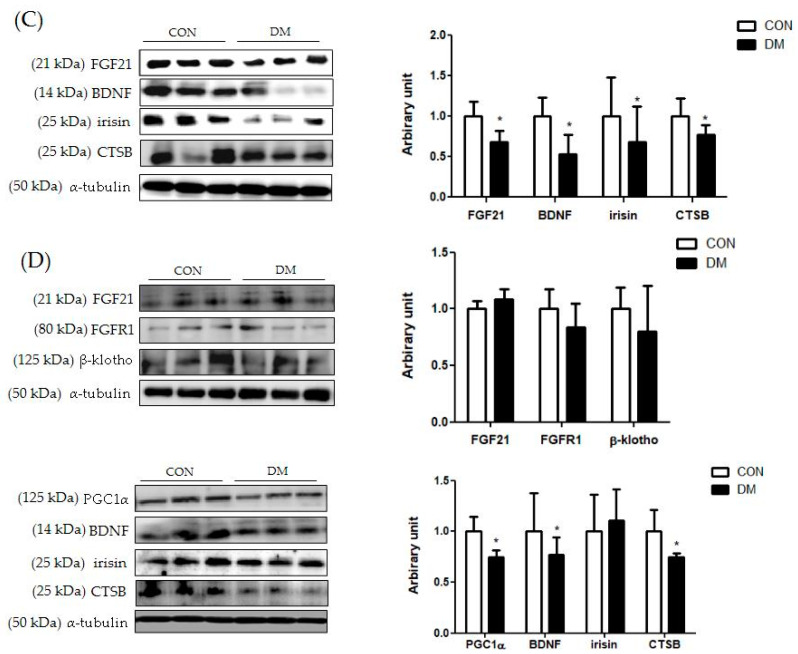
Figure 7.
Energy metabolism related markers with myokines/hepatokines and neuronal markers in T2DM mice (A) liver (B) skeletal muscle, (C) plasma, and (D) hippocampus. All values are reported as mean and SD. The asterisk represents the statistical significance of differences from * p < 0.05. n = nine mice in each group. CON, normal control mice; DM, diabetes mellitus mice.


