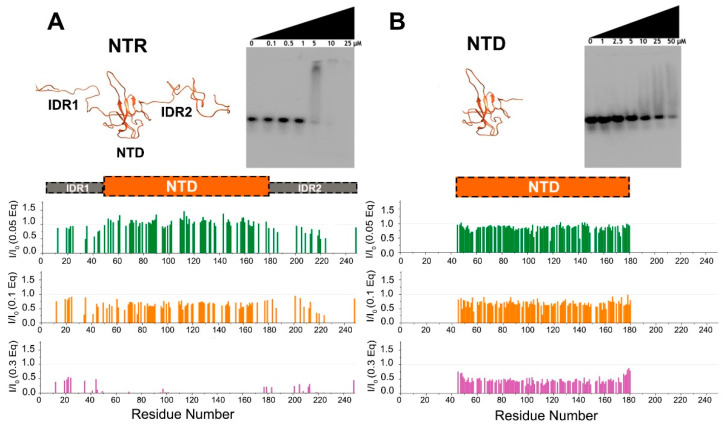
Figure 2.
Differences in the interaction of NTR (A) and NTD (B) with 5_SL4 followed by NMR and EMSA. Upper panels show the two constructs and their different binding affinities for RNA as demonstrated by EMSA experiments. The binding of NTR to RNA occurs at a lower concentration as compared to that of NTD alone. The lower panels show plots of the HN HSQC peak intensity ratios versus residue number after the addition of increasing amounts of 5_SL4 (with equivalents as indicated) relative to protein. The structural models were obtained as described in the experimental part.

