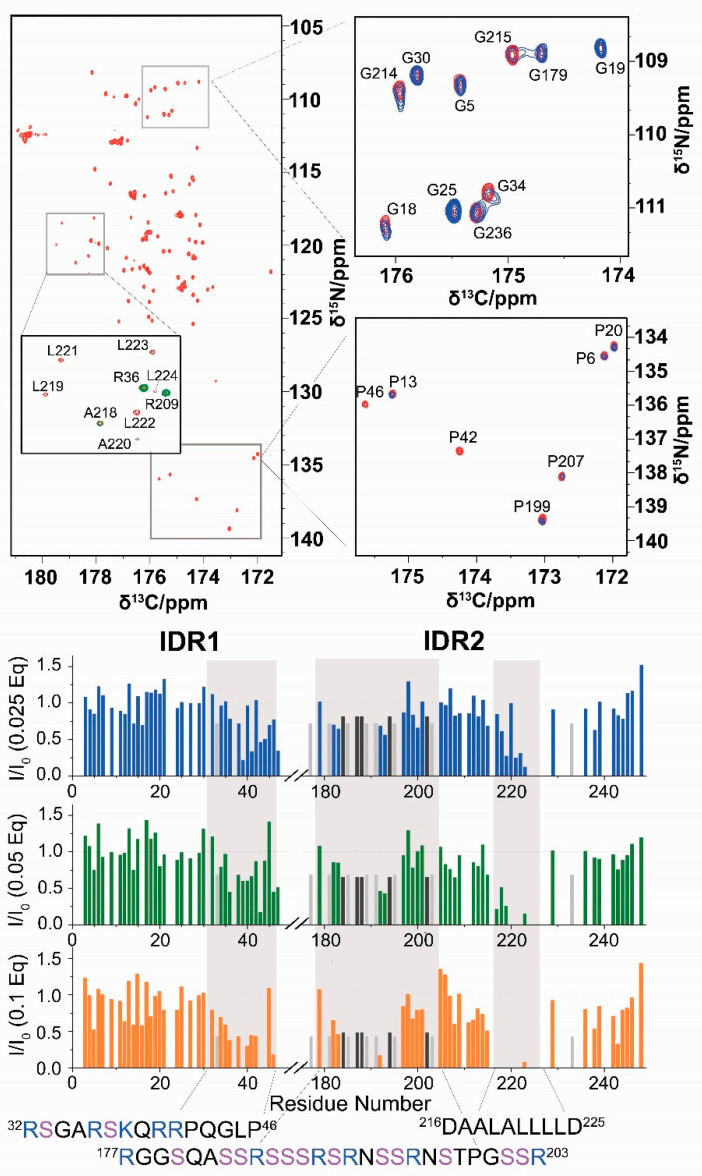
Figure 3.
2D CON experiments reveal differential effects of RNA-binding in specific regions of IDR1 and IDR2. The CON spectrum acquired on NTR is reported in red (top, left). The inset shows the superposition of the reference spectrum with NTR upon the addition of 0.01 eq of RNA (green). The enlargements of two portions of the spectra reported on the right panels (namely, the typical Gly and Pro regions) show the spectrum acquired on the NTR upon the addition of RNA (0.1 equivalents, blue) superimposed to the spectrum acquired in the absence of RNA (reference, red). The intensity ratios of CON cross-peaks are reported in the lower panel versus the residue number; spectra were acquired simultaneously to the HN spectra. Light and dark gray bars represent the intensity ratio of the envelope of signals centered at 176.6 ppm (13C)–116.5 ppm (15N) and 174.8 ppm (13C)–117.9 ppm (15N), respectively. Gray shaded areas highlight the protein regions most perturbed upon the addition of RNA.

