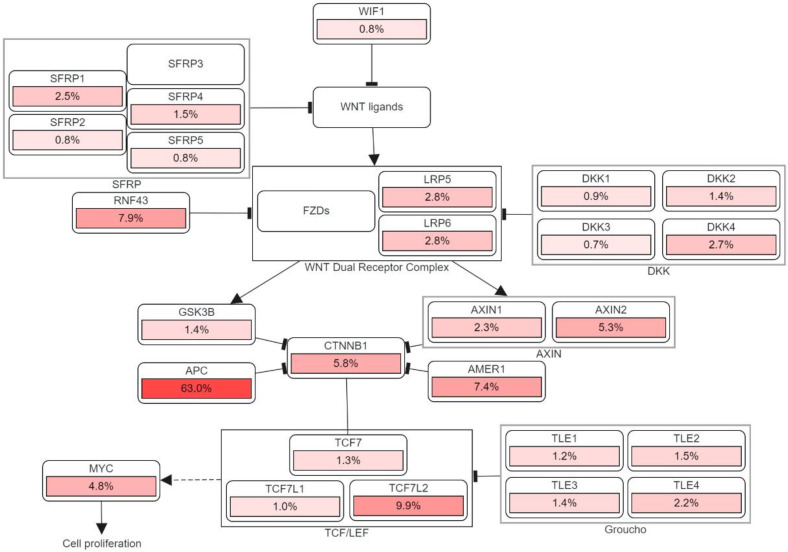
Figure 3.
The genetic pathways and frequencies of mutations collected from 13 studies and 4535 samples in the cBioportal platform that results in deregulation in Wnt signaling pathway, leading to the cell phenotypic modification. The dotted arrow illustrates induction. CTNNB1: Catenin Beta 1, TCF7: Transcription Factor 7, DKK: Dickkopf WNT Signaling Pathway Inhibitor, LRP: LDL Receptor Related Protein, SFRP: Secreted Frizzled Related Protein. The percentage under each gene represents the percent of mutated/altered samples related to the profiled ones in those studies [30,31,32,33,34,35,36,37,38].

