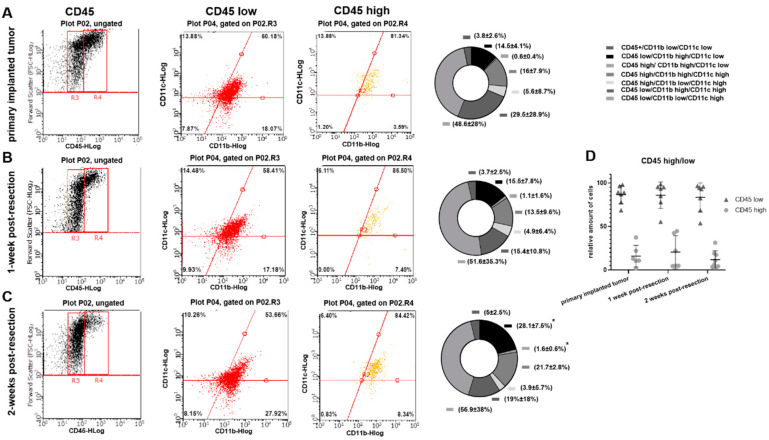
Figure 4.
Flow-cytometric analysis of myeloid cells in primary implanted tumors and tumors 1- and 2-weeks post-resection in the GL261-C57BL/6 mouse glioma implantation model. (A–C) The left column contains forward scatter (FSC) vs. CD45 plots demonstrating CD45 populations: low (R3) and high (R4). The middle column contains CD11b+ vs. C11c+ events plotted from CD45high and CD45low populations. Graphs showing proportional composition of cellular subtypes are shown in the right column. (D) Calculation of CD45high and CD45low populations of microglia/macrophages purified from primary implanted tumors and tumors 1- and 2-weeks post-resection. Mean + S.D., and significant differences from the primary implanted tumor (* p < 0.005) are shown (N = 6).

