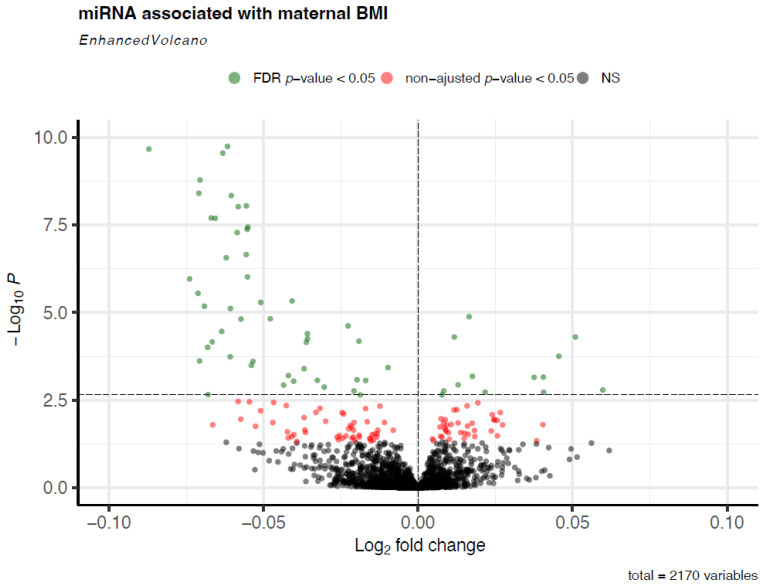
Figure 1.
Plasmatic miRNAs associated with maternal BMI at 1st trimester of pregnancy. This volcano plot shows the miRNAs associated with maternal BMI. Each point represents a single miRNA. The vertical dotted line represents a log2 fold change of 0, and the horizontal dotted line represents the FDR-adjusted q-value threshold of < 0.05. The model was adjusted for sequencing lane and run, maternal and gestational age at 1st trimester, and parity. The fold change represents the change in miRNA abundance for an increase of one unit of maternal BMI in 1st trimester of pregnancy. Abbreviations: FDR: false discovery rate; NS: not significant.

