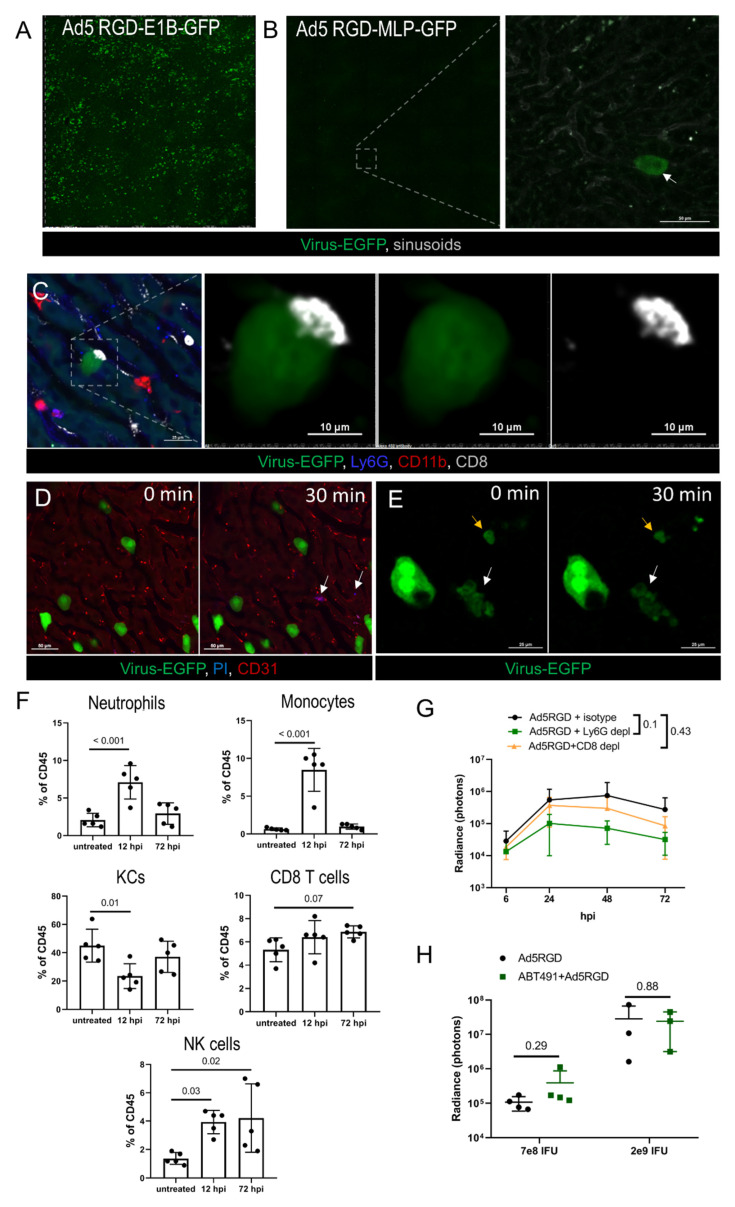
Figure 3.
Immune response and clearance of liver infection. (A,B). IVM-images of the liver at 72 hpi of Ad5-RGD vectors (1.6 × 10⁹ IFU) with EGFP expression under control of early (A) or late (B) viral promoter. Arrow indicates an extremely rare finding—EGFP expression driven by late promoter; (C). Long-term interaction of CD8+ T cell with virus-transduced hepatocyte at 24 hpi; (D). Infected hepatocytes (72 hpi) before and 30 min after i.v. injection of propidium iodide (PI). Arrows show PI signaling outside virus-transduced hepatocytes; (E). Apoptotic changes of virus-transduced hepatocyte (white arrow) recorded during 30 min; yellow arrow depicts apoptotic bodies; (F). Liver leukocyte subsets 12 and 72 hpi of 7 × 10⁸ IFU Ad5-RGD (flow cytometry; mean ± SD; p-values are shown on graph; one-way ANOVA followed by Dunnett’s multiple comparisons test); (G). Ad5-RGD (7 × 10⁸ IFU) liver transduction rates measured by bioluminescence in animals treated with anti-Ly6G (n = 5), anti-CD8 (n = 5) antibodies or isotype control (n = 4; mean ± SD; p-values are shown on graph; two-way ANOVA followed by Dunnett’s multiple comparisons test); (H). Liver transduction rates measured by bioluminescence at 24 h after injection of Ad5-RGD (7 × 10⁸ IFU or 2 × 10⁹ IFU) into mice with or without ABT-491 pretreatment (mean ± SD; p-values are shown on graph; unpaired t-test).

