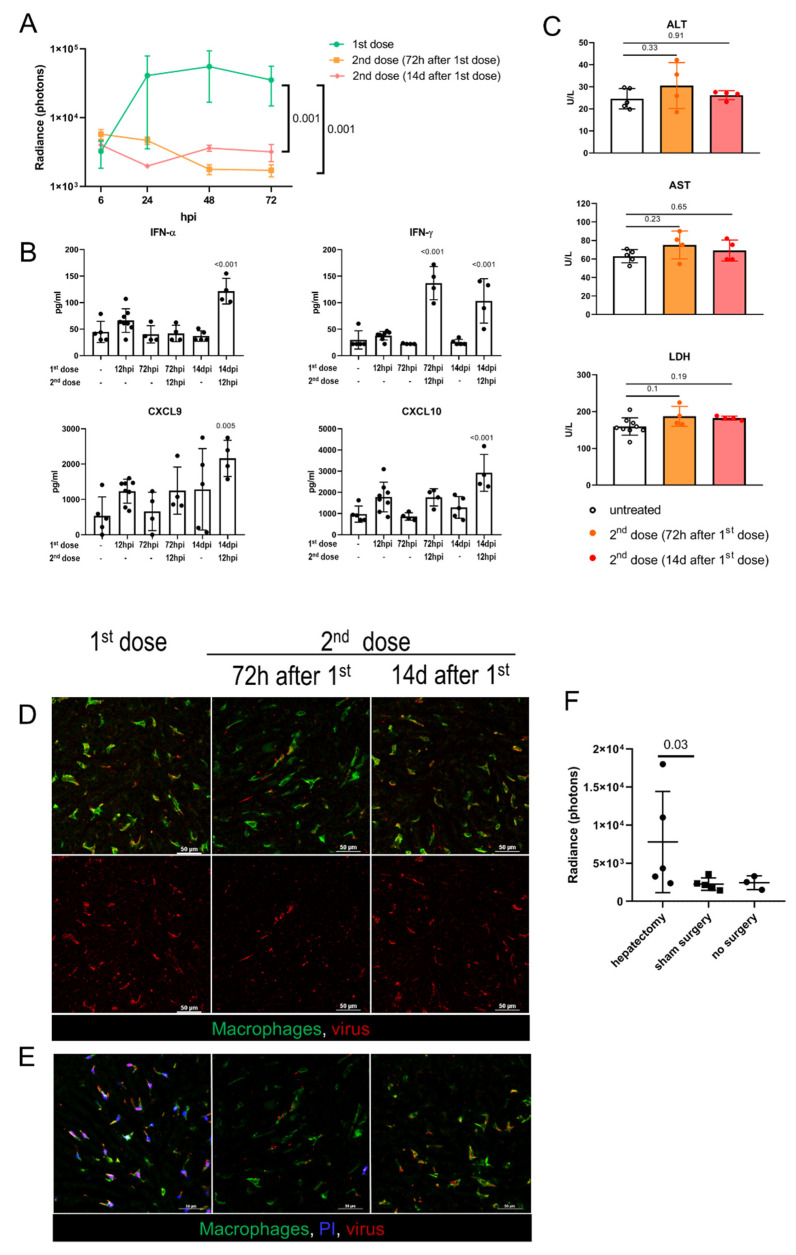
Figure 4.
Adenovirus infection and toxicity in preimmunized hosts and in regenerating liver. (A). Ad5-RGD-Fluc (7 × 10⁸ IFU) liver transduction rates measured by bioluminescence in naïve mice (first dose, n = 5) and mice pretreated with 7 × 10⁸ IFU Ad5-RGD-EGFP 72 h (second dose (72 h after 1st dose); n = 5) or 14 days (second dose (14d after first dose); n = 3) before rechallenge (mean ± SD; p-values are shown on graph; two-way ANOVA followed by Dunnett’s multiple comparisons test); (B). Plasma levels of selected cytokines in different treatment schedules (mean ± SD; p-values are shown on graph; one-way ANOVA followed by Dunnett’s multiple comparisons test); (C). Plasma levels of ALT, AST, and LDH measured at 12 hpi of the repeated Ad5-RGD dose (7 × 10⁸ IFU) re-administered 72 h or 14 days following the initial dose (mean ± SD; p-values are shown on graph; one-way ANOVA followed by Dunnett’s multiple comparisons test); (D). Representative images of the second dose uptake by KCs 30 min after injection of AF647-labeled Ad5-RGD (1010 VP); (E). KC viability 40 min after injection of initial or repeated dose of AF647-labeled Ad5-RGD assessed by exclusion of i.v. administered propidium iodide (PI). (F). Liver transduction rates measured by bioluminescence at 24 h after injection of Ad5-RGD (2 × 10⁸ IFU) into animals underwent hepatectomy or sham surgery 72 h before virus challenge (mean ± SD; p-values are shown on graph; Mann–Whitney test).

