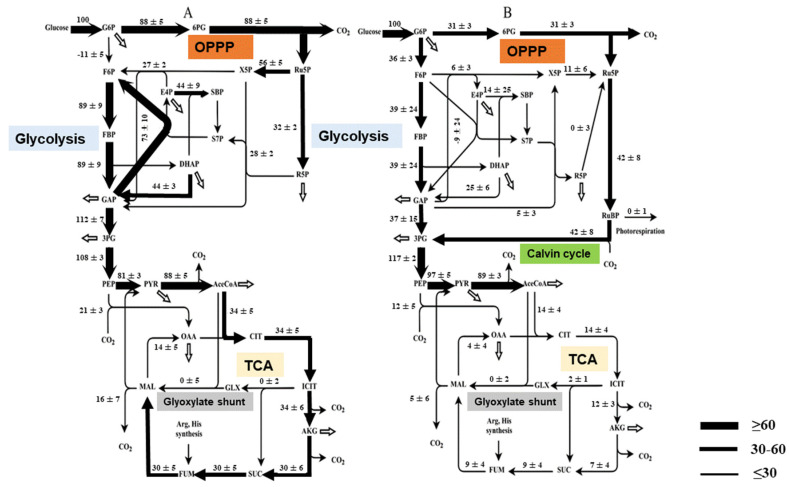
Figure 3.
Flux distribution in the central metabolism of C. sorokiniana. (A) Heterotrophically cultured C. sorokiniana cells; (B) mixotrophically cultured C. sorokiniana cells. All estimated relative flux rates are shown next to the pathways, which are normalized to the glucose uptake rate. The standard deviation of each flux is shown, which was calculated based on the 95% confidence intervals (Supplementary Materials, File S3). The solid arrows represent the directions of the net fluxes and the wider arrows show higher flux rates. The open arrows represent the fluxes to the biomass.

