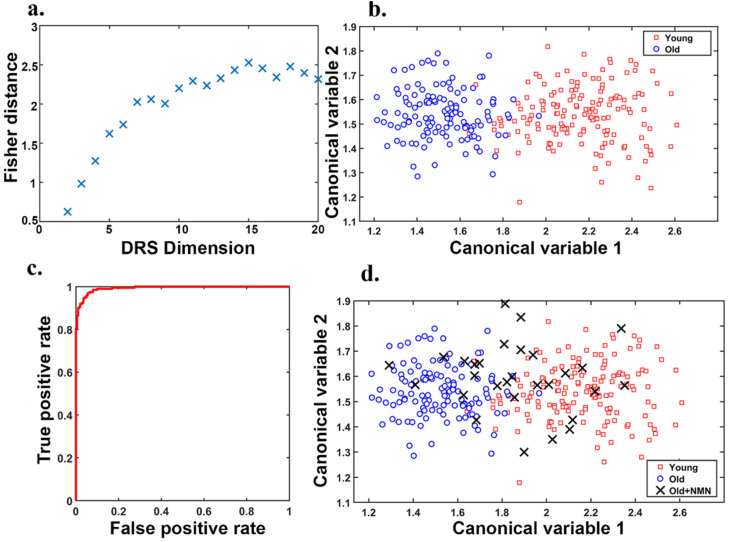
Figure 3.
(a) Improvement in DRS discriminative power measured by Fisher Distance (FD) with an increasing number of DRS features. (b) Discrimination of old and young oocyte morphology using our optimal DRS (points represent oocytes with data augmentation: Number of old data points after augmentation = 126, Number of young data points after augmentation = 156), Figure with no data augmentation is shown in Supplementary Figure S4 (c) Classification performance curve of receiver operating characteristics (ROC) for our optimal DRS with 15 features. (d) DRS discrimination of oocytes from young and old animals as shown in (b) overlaid with oocytes from aged animals treated with the NAD precursor NMN (Number of NMN data points = 29), each data point represents an individual oocyte.

