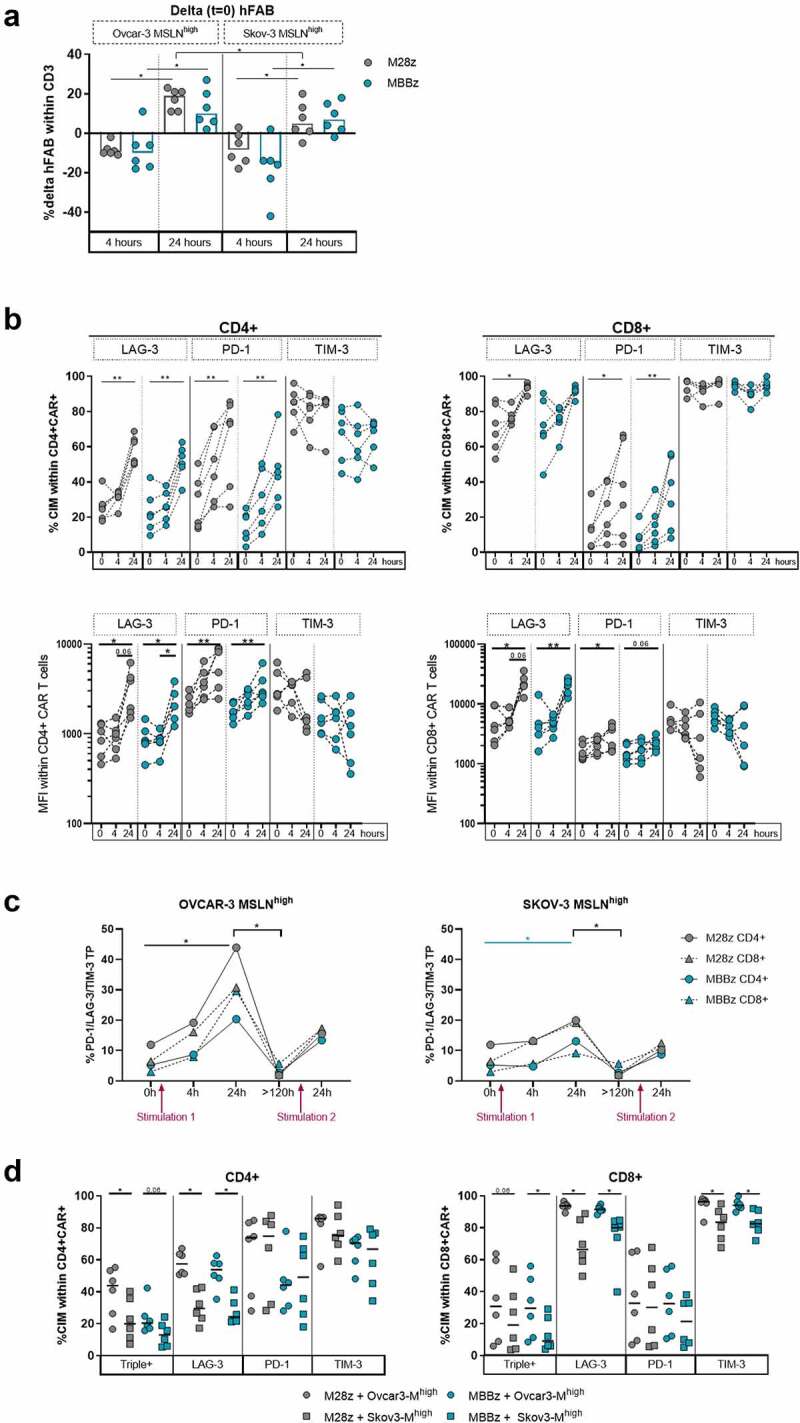
Figure 6.

Dynamic expression of PD-1, LAG-3 and TIM-3 exhaustion markers by M28z and MBBz CAR T cells after co-culture with target cells. A) Prior to start of experiment (t = 0), CAR surface expression on M28z and MBBz transduced T cells was determined by hFAB staining. During co-culture with MSLNhigh OVCAR-3 and SKOV-3 hFAB expression was monitored. B) Kinetics of PD-1, LAG-3 and TIM-3 frequency (top) and MFI (bottom, logarithmic y-axis) within CD4+ or CD8+ CAR+ M28z and MBBz transduced T cells prior (0 h) and during co-culture (4 h and 24 h) with MSLNhigh OVCAR-3 cells. Each dot represents one donor, n = 6 donors. C) Frequency of PD-1/LAG-3/TIM-3 triple positive (TP or Triple+) within CAR+ M28z and MBBz transduced T cells overtime. Median of 6 donors is displayed. D) Comparison between CIM (co-)expression following 24 hours of co-culture with MSLNhigh OVCAR-3 and SKOV-3 cells. Each dot represents one donor, n = 6 donors. Grey symbols represent M28z CAR T cells and green symbols represent MBBz CAR T cells. Wilcoxon tests were performed to compare between two time points, CAR constructs and cell lines (delta hFAB 4 hours vs 24 hours, M28z vs MBBz, and OVCAR-3 vs SKOV-3). Friedman tests were used per CAR construct over time (≥3 time points). * = P < .05, ** = P < .01.
