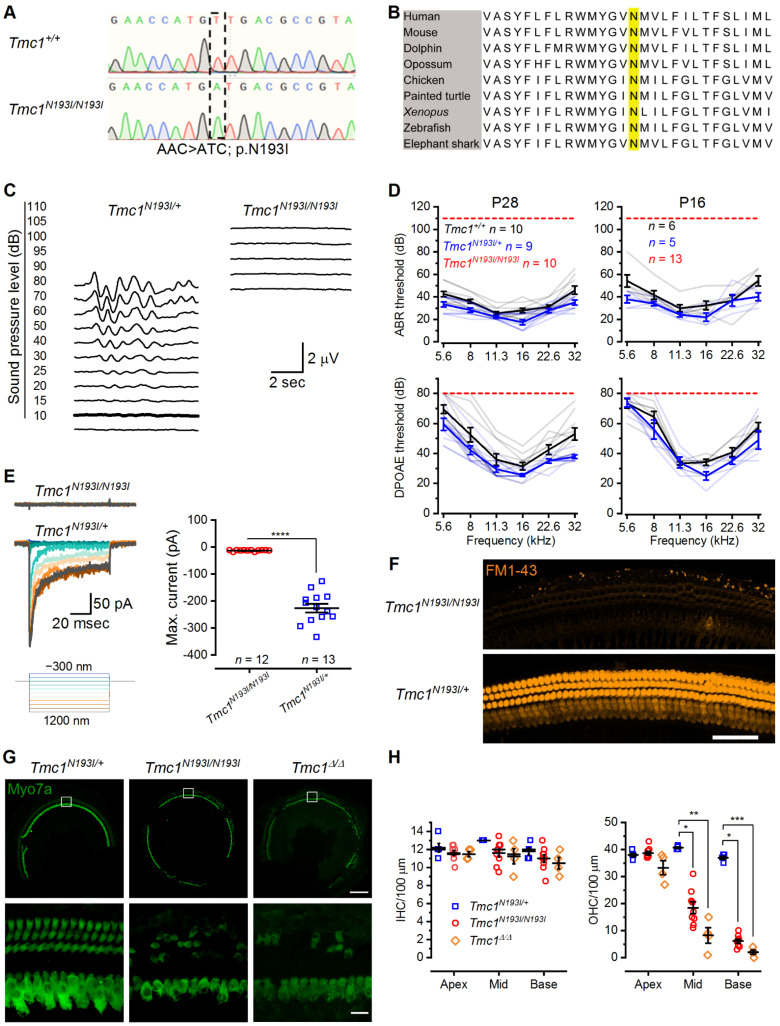
Figure 1.
p.N193I mouse line generation and characterization. (A) Chromatogram of Sanger sequencing showing the wild-type (AAC) and the p.N193I (ATC) mouse genomic DNA sequences. (B) Multiple alignment of TMC1 first transmembrane domain containing the highly conserved N (yellow). Human: Homo sapiens; Mouse: Mus musculus; Dolphin: Tursiops truncatus; Opossum: Monodelphis domestica; Chicken: Gallus gallus; Painted turtle: Chrysemys picta bellii; Xenopus: Xenopus tropicalis; Zebrafish: Danio rerio; Elephant shark: Callorhinchus milii. (C) Representative ABR waveforms from Tmc1N193I/+ and Tmc1N193I/N193I mice recorded at 4 weeks of age for 16 kHz tone bursts at increasing sound-pressure levels (dB). Thresholds are indicated by thicker traces and were determined by the presence of peak 1. Scale bar applies to both recordings. (D) ABR (up) and DPOAE (down) thresholds (dB) as a function of the frequency (kHz) for P28 (left) and P16 (right) wild-type (black), Tmc1N193I/+ (blue) and Tmc1N193I/N193I (red) mice. Mean ± S.E.M. thresholds are shown in darker tones, and lighter traces correspond to individual recordings. (E) Mechanosensory transduction currents recorded from IHCs of Tmc1N193I/+; Tmc2Δ/Δ (blue) and Tmc1N193I/N193I; Tmc2Δ/Δ (red) P7-8 mice. Representative currents recorded at −84 mV and stimulation protocol (left). Mean ± S.E.M. maximal current amplitudes recorded for 12 (Tmc1N193I/N193I; Tmc2Δ/Δ) or 13 (Tmc1N193I/+; Tmc2Δ/Δ) individual cells, from 3–5 different animals (right). **** p < 0.0001, Mann–Whitney test. (F) Confocal microscopy images of live cochleas focused at the hair cell level, from Tmc1N193I/+; Tmc2Δ/Δ and Tmc1N193I/N193I; Tmc2Δ/Δ P6 mice incubated with 5 μM FM1-43 (orange) for 10 s. Scale bar: 50 μm. (G) Representative confocal images from middle cochlear sections of Tmc1N193I/+, Tmc1N193I/N193I and Tmc1Δ/Δ P28 mice immunostained against myosin 7a (green). Scale bars: top panels (10×) 200 µm; lower panels (63×) 15 µm. White boxes (above) indicate region shown at higher magnification (below). (H) Mean ± S.E.M. hair cell counts per 100 µm sections of IHC (left) and OHC (right) from P28 Tmc1N193I/+ (n = 5), Tmc1N193I/N193I (n = 9) and Tmc1Δ/Δ (n = 4) measured in the apex, middle and base cochlear turns. Individual samples are included in the scatterplots * p < 0.05; ** p < 0.01; *** p < 0.001; Kruskal—Wallis followed by Dunn’s multiple comparison test.

