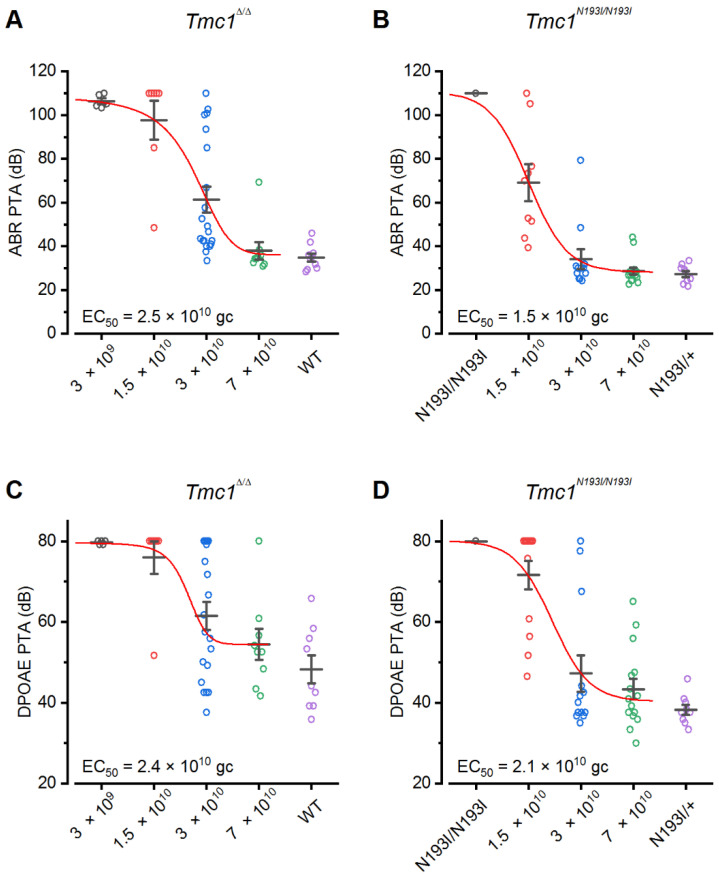
Figure 4.
Dose–response curve of the AAV2/9-PHP.B-CB6-hTMC1 + WPRE gene therapy construct. Pure tone average (PTA) ABR (A,B) or DPOAE (C,D) thresholds of Tmc1Δ/Δ (A,C) or Tmc1N193I/N193I (B,D) injected with different doses of CB6-hTMC1 + WPRE (3 × 10⁹ gc–7 × 10¹⁰ gc). PTAs from uninjected controls are included in the plots for comparison.

