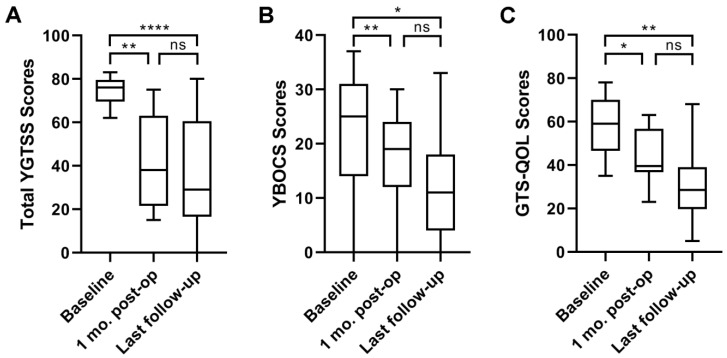
Figure 2.
The assessment of tics, obsessive compulsive disorder, and quality of life of the TS patients. The total YGTSS scores (A), YBOCS scores (B), and GTS-QOL scores (C) of the patients one month after surgery and at the last follow-up assessment were significantly decreased compared with those at baseline (A: p < 0.05, Friedman test followed by Dunn’s post hoc test, n = 13, number of patients for A assessment; B, C: p < 0.05, ANOVA followed by Tukey’s multiple comparisons test, n = 11/10, number of patients for B/C assessment). Data are presented in boxplots. * p < 0.05, ** p < 0.01, and **** p < 0.0001; ns, no significant difference.

