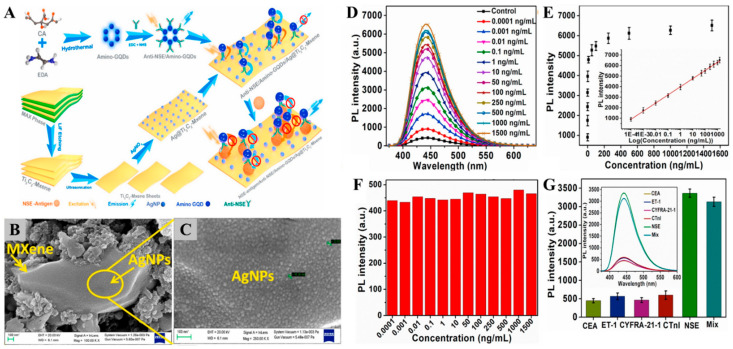
Figure 8.
(A) Schematic illustration of the anti-NSE/amino-GQDs/Ag@Ti3C2Tx based fluorometric NSE detection. (B,C) FE-SEM images of Ag nanoparticles decorated Ti3C2Tx MXene at different magnifications. (D) Analytical performance of the anti-NSE/amino-GQDs/Ag@Ti3C2Tx based fluorescent biosensor toward NSE detection. (E) Graph showing the correlation between recovered fluorescence and NSE concentration, inset shows the corresponding calibration curve between recovered fluorescence and log NSE concentration in the range of 1 × 10⁻⁴–1.5 × 10³ ng/mL. (F) Selectivity of the proposed biosensor. (G) Control experiment for the amino-GQDs/Ag@Ti3C2Tx electrode. Reprinted with permission from Ref. [152]. Copyright © 2022 Elsevier.

