Figure 3.
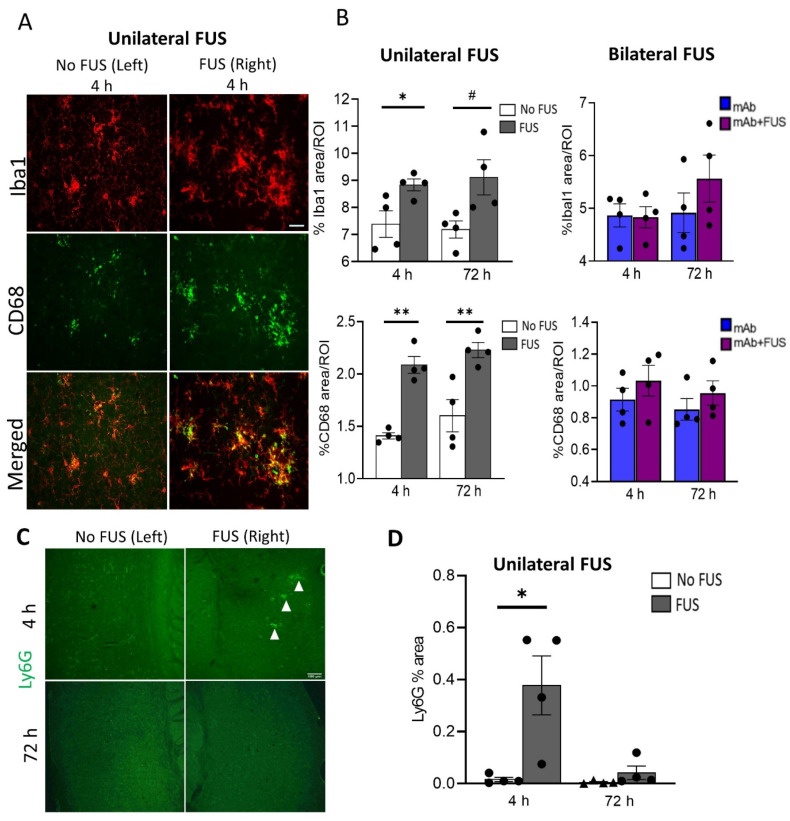
Acute immune response after single dose of 07/2a and FUS treatment. (A) Representative images (20×) for Iba1 and CD68 immunoreactivity after 4 h of 07/2a administration and unilateral sonication on the right hemisphere indicating increased microglial area coverage in the cortex compared to the non-FUS contralateral left hemisphere. (B) Quantitative analysis for general microglial marker (Iba1) and phagocytic marker (CD68) coverage in the cortical region from unilateral FUS cohort. After 07/2a mAb administration and sonication on the right hemisphere an increase in glial activity was seen compared to the contralateral left hemisphere (No FUS) control. Paired t-tests (two-tailed, α = 0.05). In the bilateral FUS cohort, 07/2a mAb treated alone or 07/2a + FUS treated mice after 4 h and 72 h post treatment showed a slight increase in glial activity. Data are represented as mean ± SEM. Two-Way ANOVA with Bonferroni’s multiple comparison test. (C) Representative pictures (4×) of Ly6G staining after 4 & 72 h treatment in the sonicated right hemisphere and contralateral non sonicated hemisphere. White arrowheads indicate Ly6G+ staining. (D) Area positive for Ly6G measured in the 4 h & 72 h unilateral FUS cohort expressed as percentage cerebral area, Paired t-tests (two-tailed, α = 0.05). Black dots represent data from individual mice. # p = 0.05, * p < 0.05, ** p < 0.005. Scale bar (B) = 50µm, (D) = 100 µm.

