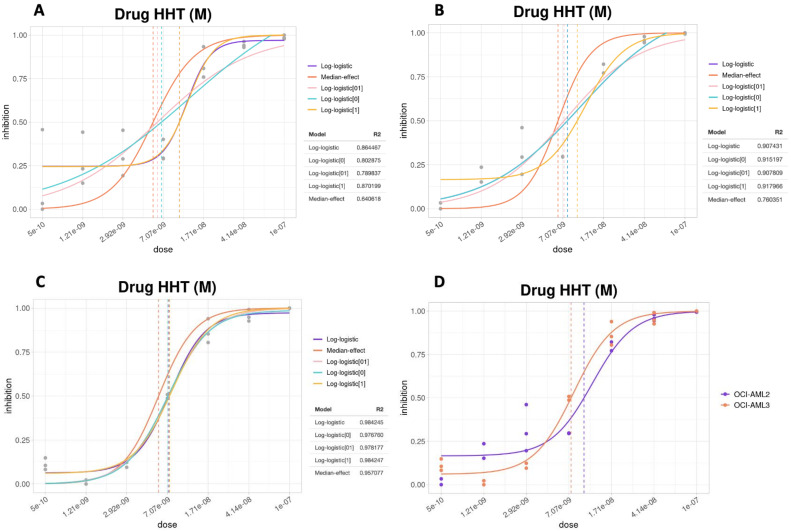
Figure 5.
Dose–response curves for HHT on OCI-AML2 and OCI-AML3 at 72 h. (A,B) Curves obtained with OCI-AML2 according to the different models and data before (A) and after (B) outliers’ removal. (C) Curves obtained with OCI-AML3 according to the different models. (D) Comparison between OCI-AML2 and OCI-AML3 cell lines treated with HHT. The concentration of the drug is shown on the x-axis and the proportion of inhibition is shown on the y-axis.

