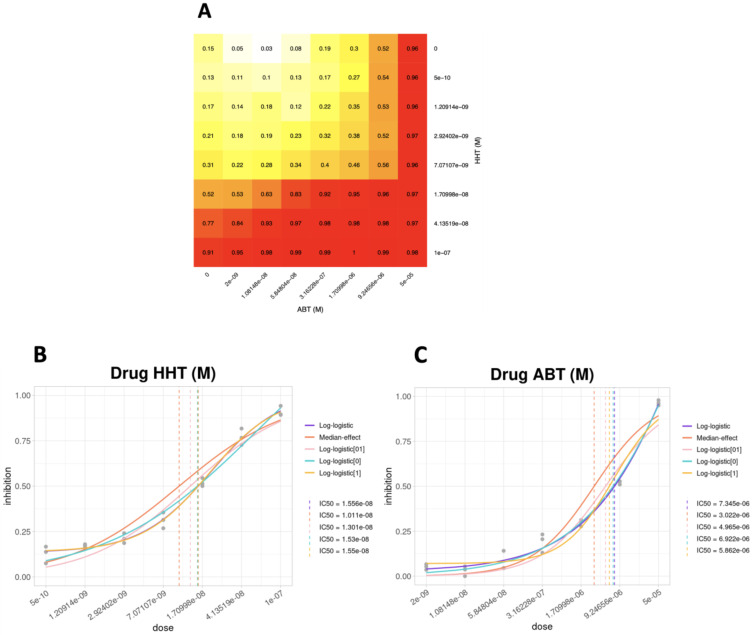
Figure 6.
Combinatorial HHT/ABT drug treatment analysis in OCI-AML3. (A) Heatmap of normalized inhibition levels. (B,C) Dose–response curves according to the five different models available in SiCoDEA, for OCI-AML3 cell line treated with HHT drug (B) and ABT drug (C) for 48h. The drug concentration is shown in the x-axis and the proportion of cells that have undergone inhibition in the y-axis.

