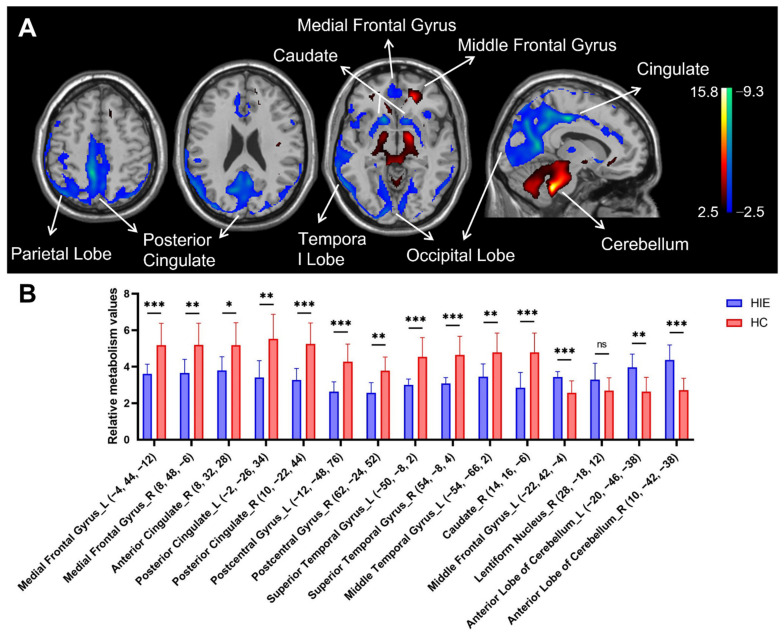
Figure 1.
Brain regions with relative abnormal metabolism in patients with hypoxic ischemic encephalopathy (HIE) presenting with disorders of consciousness (DOC). (A) Normalized glucose metabolism in the HIE patients decreased (blue) bilaterally in the medial frontal gyrus, posterior cingulate gyrus (extending to parietal-occipital lobe), postcentral gyrus and superior temporal gyrus, and in the right anterior cingulate gyrus and right caudate nucleus, but increased (red) in bilateral anterior cerebellar lobe and left middle frontal gyrus and right lentiform nucleus relative to the healthy controls (HC). The overlays are depicted in neurologic orientation. The gray-scale image is a T1-weighted structural magnetic resonance imaging (MRI) that is representative of Montreal Neurological Institute (MNI) space. The thresholds of the color bars represent T values. (B) Differences in regional glucose metabolism in the HIE patients and HC subjects illustrated by post hoc values obtained within a spherical volume of interest (VOI) (3 mm radius) with the center coordinates of each VOI given in the parentheses. The graphs showed the relative metabolic value decreases in the bilateral medial frontal gyrus, posterior cingulate gyrus, postcentral gyrus and superior temporal gyrus, and right anterior cingulate gyrus and right caudate nucleus, while the relative metabolic value increases in bilateral anterior cerebellar lobe and left middle frontal gyrus. The error bars represent standard deviation. ns, no statistical difference. HIE, hypoxic ischemic encephalopathy. HC, healthy control. L, left. R, right. *, p < 0.05. **, p < 0.01, ***, p < 0.001.

