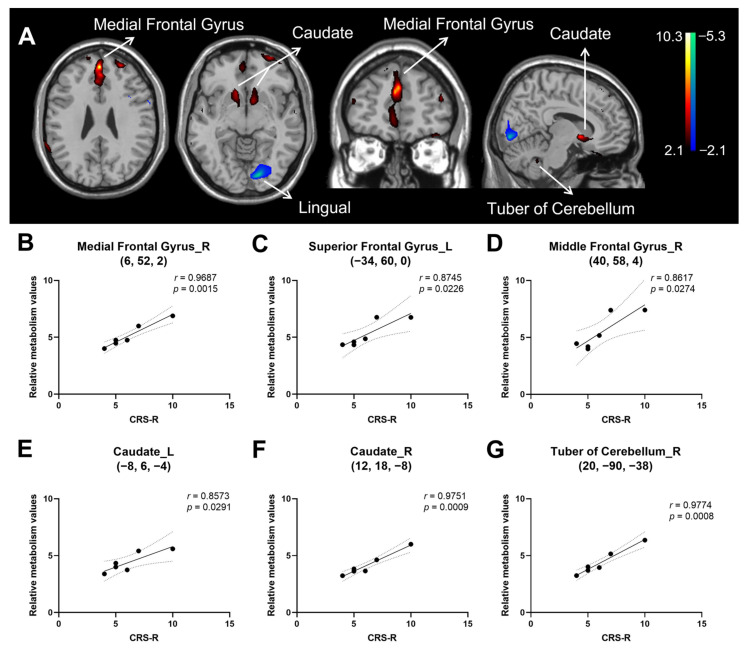
Figure 2.
Brain regions correlated with Coma Recovery Scale-Revised (CRS-R) score in hypoxic ischemic encephalopathy (HIE) patients presenting with disorders of consciousness (DOC). (A) Regions with positive correlation (red) were observed bilaterally in the medial frontal gyrus, middle frontal gyrus, anterior cingulate and caudate, and in the left superior frontal gyrus, left inferior frontal gyrus and right tuber of cerebellum, whereas those with negative correlation (blue) were found in the left lingual gyrus. The overlays are depicted in neurologic orientation. The gray-scale image is a T1-weighted structural magnetic resonance imaging (MRI) that is representative of Montreal Neurological Institute (MNI) space. The thresholds of the color bars represent T values. (B–G) Correlation between relative metabolic values and CRS-R score the right medial frontal gyrus. Dotted lines represent 95% confidence bands of the best-fit line. (B), left superior frontal gyrus (C), right middle frontal gyrus (D), left caudate (E), right caudate (F), right tuber cerebellum (G). The metabolic values were obtained post hoc within a spherical volume of interest (VOI) (3 mm radius) with the center coordinates of each VOI given in the parentheses on each panel. L, left. R, right. CRS-R, coma recovery scale—revised version.

