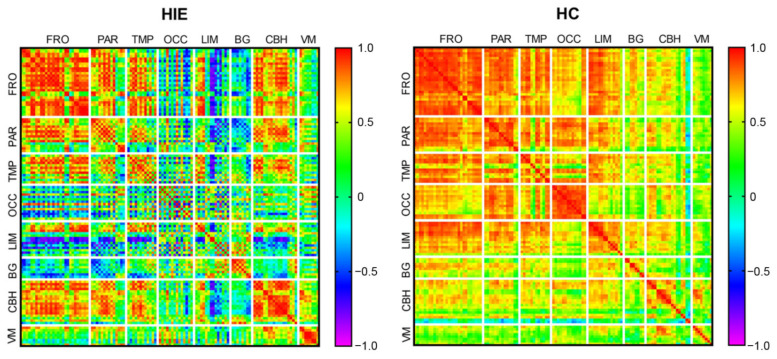
Figure 3.
Global metabolic connectivity matrix. Colors in the metabolic connectivity matrix represent the magnitude of the correlation and colors are arranged as a rainbow color from red to purple according to the magnitude of the correlation from positive to negative. HIE, hypoxic ischemic encephalopathy. HC, healthy control. FRO, frontal cortex. PAR, parietal cortex. TMP, temporal cortex. OCC, occipital cortex. LIM, limbic structures. BG, basal ganglia. CBH, cerebellum hemisphere. VM, vermis of cerebellum.

