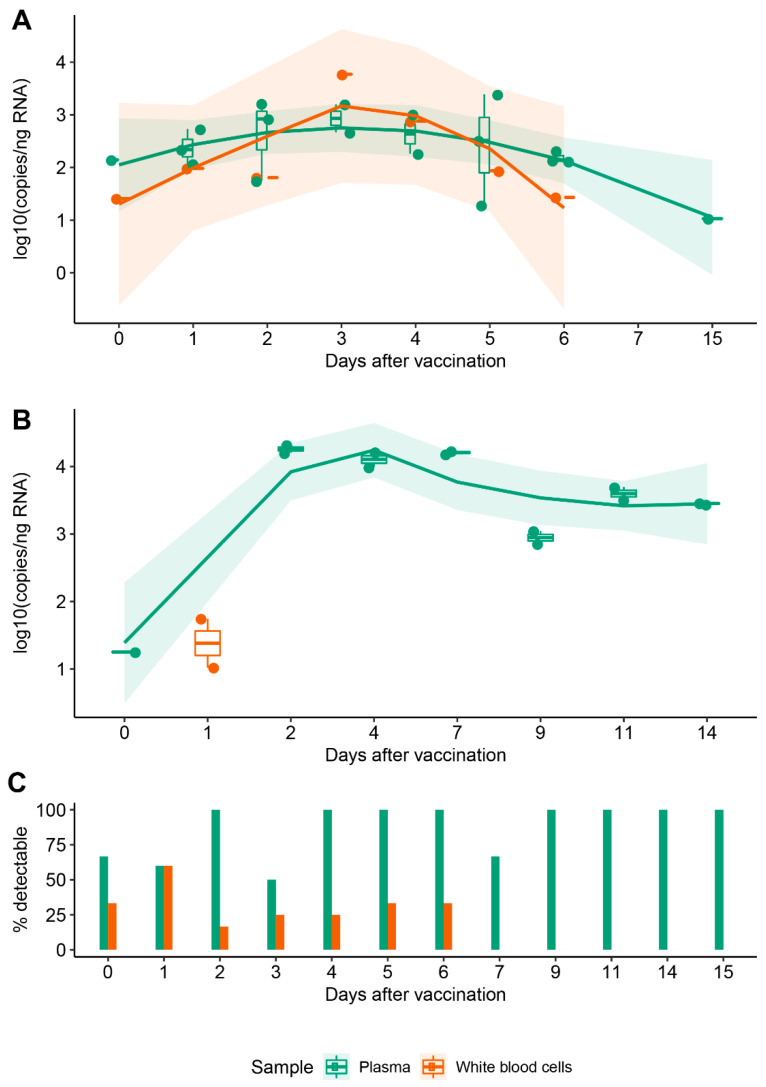
Figure 1.
Persistence of synthetic mRNA in blood following vaccination. (A) Distribution of synthetic mRNA copy number normalised to the equivalent quantity of input RNA in a cohort of 16 individuals; each point represents an independent biological sample. (B) Distribution of synthetic mRNA copy number normalised to the equivalent quantity of input RNA in a single individual; technical replicates are shown for all timepoints analyzed. For (A,B), trendlines were fitted using locally estimated scatterplot smoothing (LOESS) regression to observe variations of mRNA in plasma (green) and cellular fraction (orange) in the days following vaccination. Only data corresponding to copy numbers above LoQ = 10 are shown. (C) Cumulated likelihood of detecting synthetic mRNA in plasma and cellular fractions across subjects and days following vaccination.

