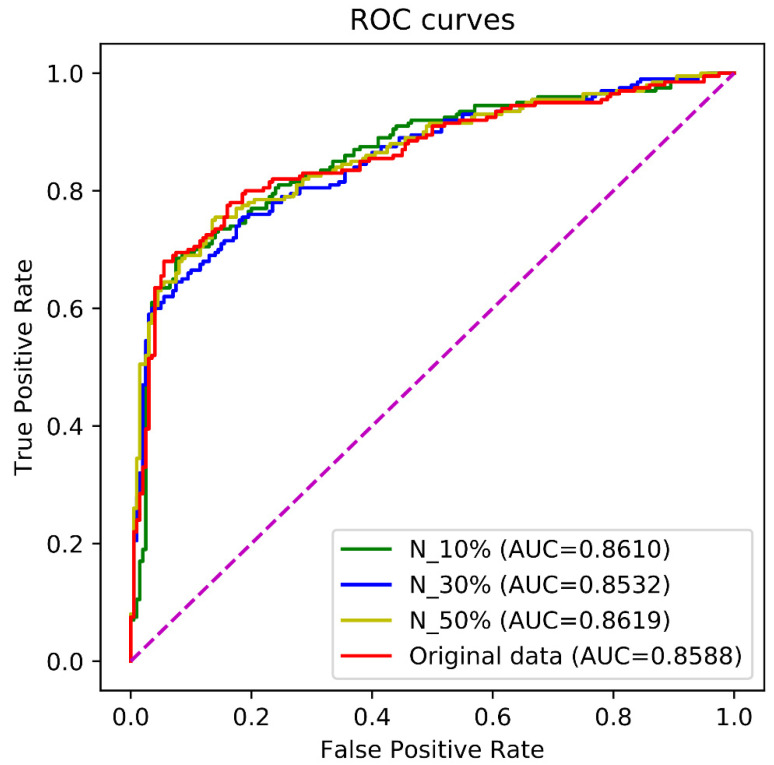
Figure 6.
The ROC curves by the independent test over different non-enhancer sets. N_10, N_30, and N_50 denote the training sets in which 10%, 30%, 50% of non-enhancers were formed by mutation from the original non-enhancers, respectively. The original data denotes the training set which was made up of the enhancers and original non-enhancers. The purple line is the baseline of ROC curve, named random guessing line.

