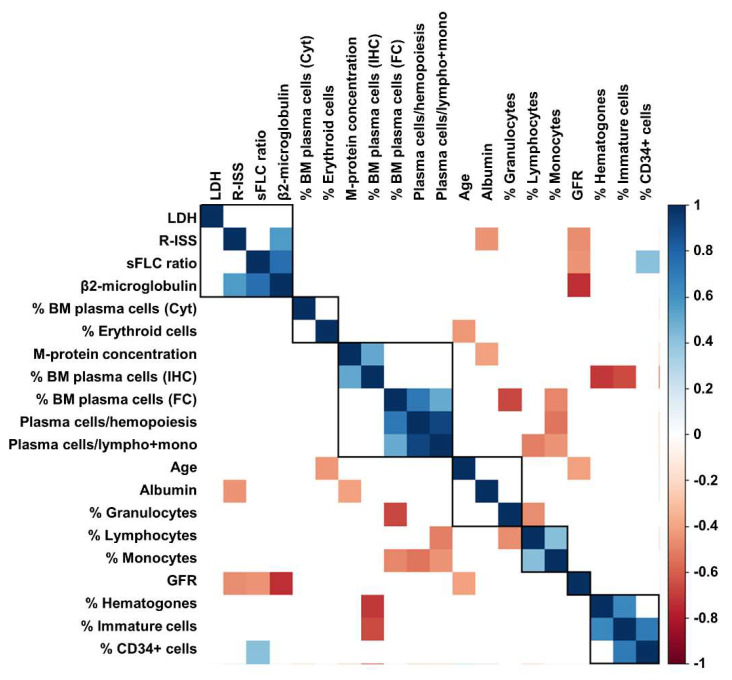
Figure 2.
Correlation analysis between clinical and laboratory markers. Correlation analysis was performed with Pearson analysis among serum standardized free light-chain (sFLC) ratio, lactate dehydrogenase (LDH), Revised International Staging System (R-ISS) stages, bone marrow (BM) plasma cells detected by morphology (Cyt), immunohistochemistry (IHC) or flow cytometry (FC), percent of BM populations detected by FC, laboratory, and clinical findings, such as glomerular filtration rate (GFR).

