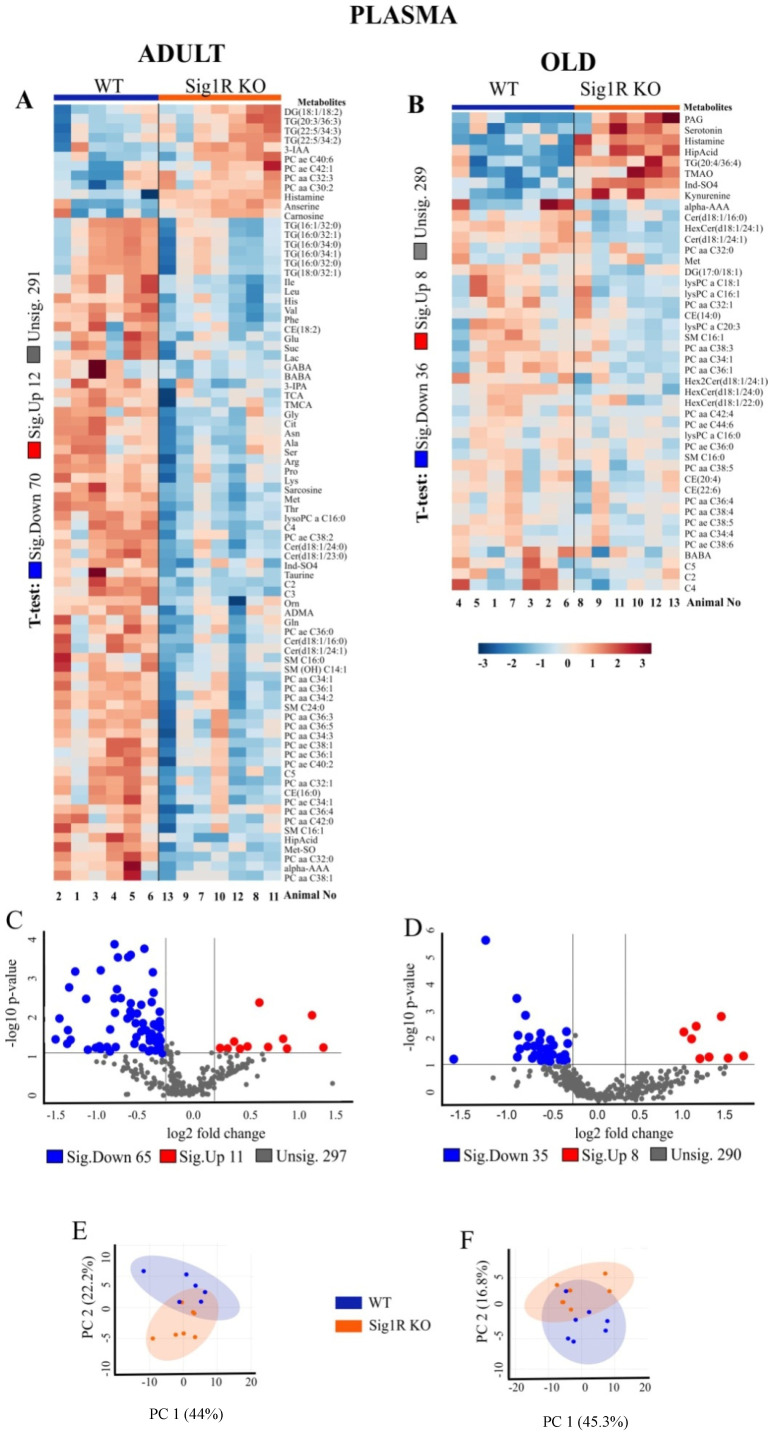
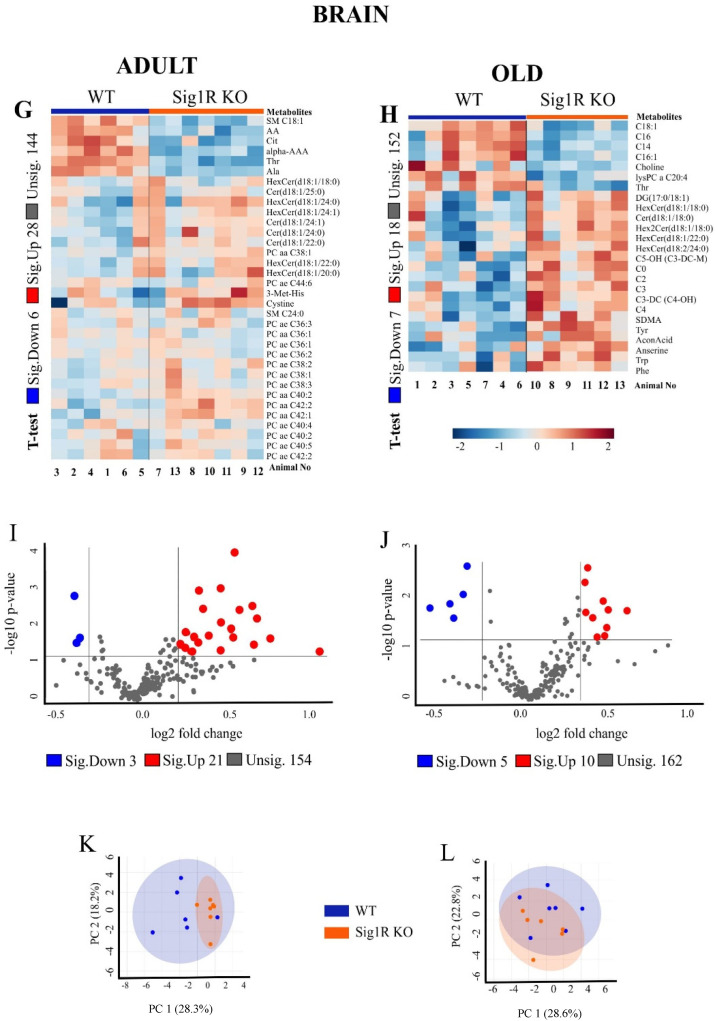
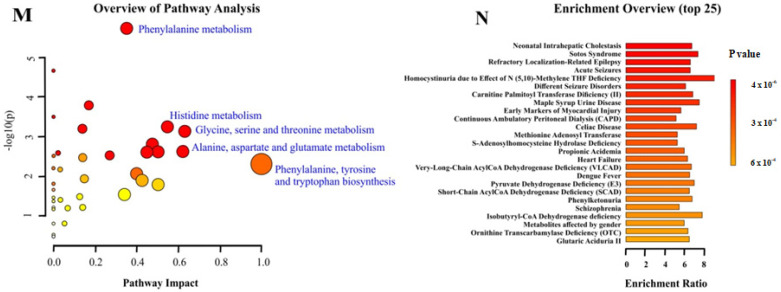
Figure 2.
Metabolomic analysis revealed decreased amino acids and effects on related metabolite pathways in Sig1R KO mice. (A) Heatmap analysis highlighting metabolites showing the significant changes in plasma between adult WT and Sig1R KO mice. (B) Heatmap analysis highlighting me-tabolites showing the significant changes in plasma between old WT and Sig1R KO mice. (C,D) Volcano plot showing statistical significance (p value < 0.05) versus the magnitude of change (over 1.2) in plasma. (E,F) Score plots of PCA-discriminated metabolites in plasma between the WT and Sig1R KO groups. (G) Heatmap analysis highlighting metabolites showing the significant changes in brain tissue between adult WT and Sig1R KO mice. (H) Heatmap analysis highlighting metabolites showing the significant changes in brain tissue between old WT and Sig1R KO mice. (I,J) Volcano plot showing statistical significance (p value < 0.05) versus the magnitude of change (over 1.2) in brain tissue. (K,L) Score plots of PCA-discriminated metabolites in brain tissue between the WT and Sig1R KO groups. (M) The metabolome view shows all matched pathways according to the p values from the pathway enrichment analysis and pathway impact values from the pathway topology analysis. (N) Summary plot for quantitative enrichment analysis (QEA). Plasma and brain tissue samples were collected from 6- and 18-month-old WT and Sig1R KO mice (n = 6–7 mice/group). Analyses were produced using MetaboAnalyst 5.0. Sig.—significantly, Unsig.—unsignificantly.


