Figure 3.
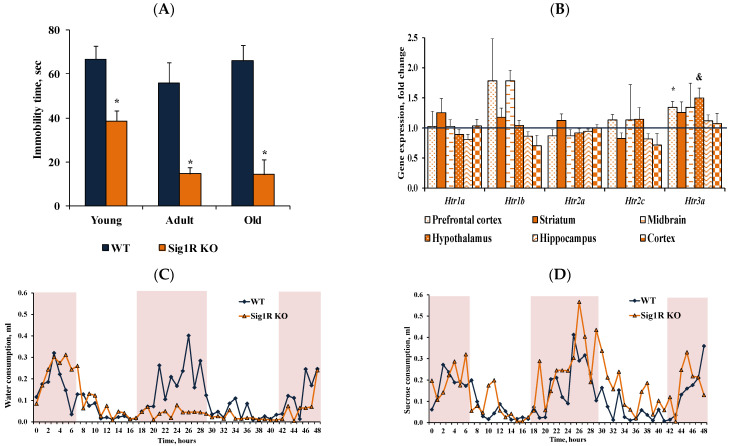
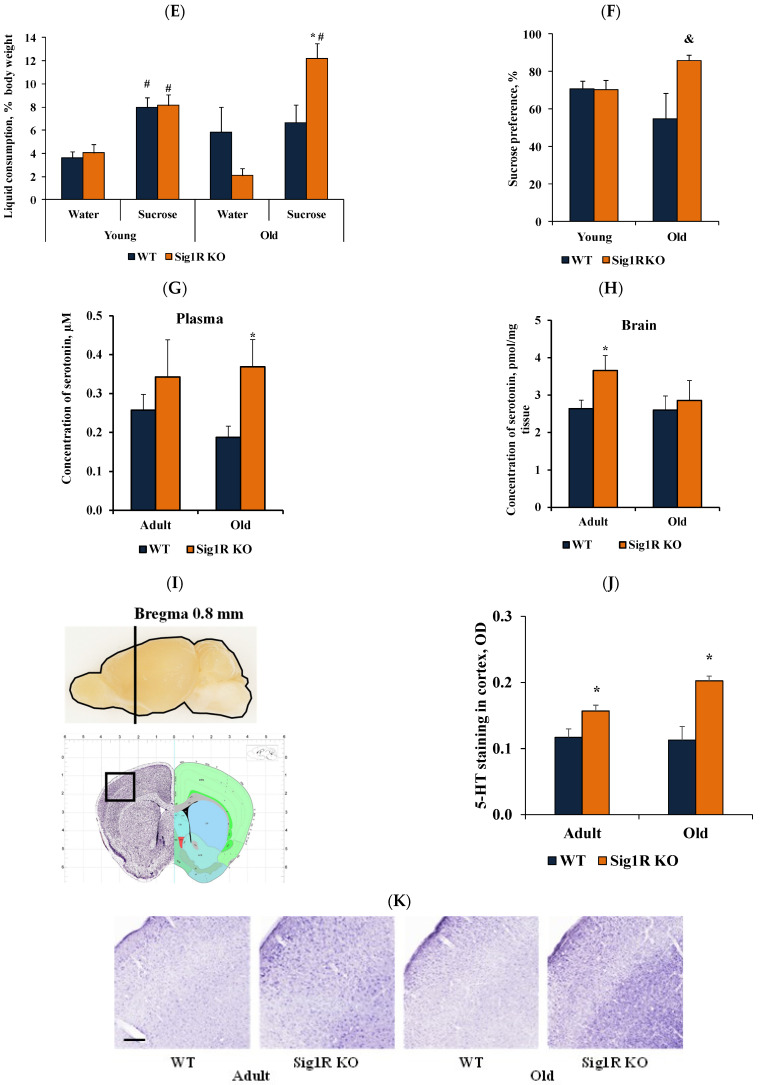
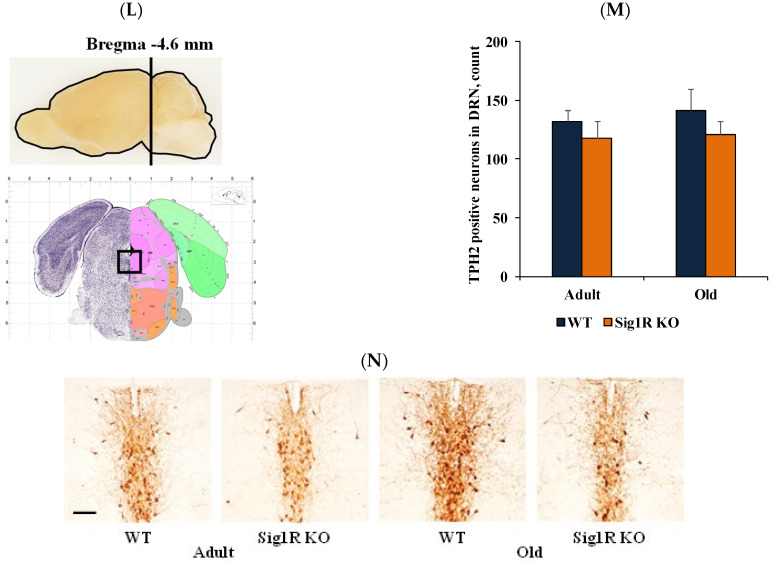
Reduced behavioral despair was associated with increased serotonin concentrations in Sig1R KO mice. (A) Immobility time (s) of young (2 months), adult (6 months), and old (15 months) WT and Sig1R KO mice was measured using the tail suspension test (n = 6–15 mice/group; two-way ANOVA followed by the Sidak test). (B) 5-HT receptor gene (Htr1a, Htr1b, Htr2a, Htr2c, and Htr3a) expression in the prefrontal cortex, striatum, midbrain, hypothalamus, hippocampus, and cortex of adult (4 months) WT and Sig1R KO mice (n = 8 mice/group; unpaired t test). (C) Water consumption of old (14 months) Sig1R KO (n = 6 mice/group) and WT (n = 8 mice/group) male mice was measured using the PhenoMaster system (shaded area indicates dark hours 8 a.m.–8 p.m.). (D) Sucrose solution consumption of old (14 months) Sig1R KO (n = 6 mice/group) and WT (n = 8 mice/group) male mice was measured using the PhenoMaster system (shaded area indicates dark hours, 08:00–20:00). (E) Combined consumption of water and sucrose solution (% of body weight) by young (2 months) and old (14 months) mice was measured using the PhenoMaster system (n = 6–13 mice/group; unpaired t test). (F) Calculated sucrose preference (%) of young (2 months) and old (14 months) mice was measured using the sucrose preference test (n = 6–13 mice/group; unpaired t test). (G) Serotonin concentration in the plasma of adult (6 months) and old (18 months) Sig1R KO and WT mice (n = 6–7 mice/group; unpaired t test). (H) Serotonin concentration in brain tissue of adult (6 months) and old (18 months) Sig1R KO and WT mice (n = 6–7 mice/group; unpaired t test). (I–K) Anatomical position for 5-HT and (L–N) TPH2 staining was validated using the Allen Mouse Brain atlas (http://mouse.brain-map.org/static/atlas, accessed on 18 May 2020). (J) Measured optical density (OD) of the staining intensity of 5-HT in the cortex (n = 6 mice/group; two-way ANOVA followed by Tukey’s test). (K) Representative histological images of 5-HT staining in the cortex (scale bar = 300 µm). (M) Number of TPH2-stained cells in the dorsal raphe nucleus (DRN) (n = 6 mice/group). (N) Representative histological images of TPH2 staining in the DRN (scale bar = 100 µm). Data are shown as the mean ± SEM (* p < 0.05 vs. WT; & p < 0.06 vs. WT; # p < 0.05 vs. same water consumption group).


