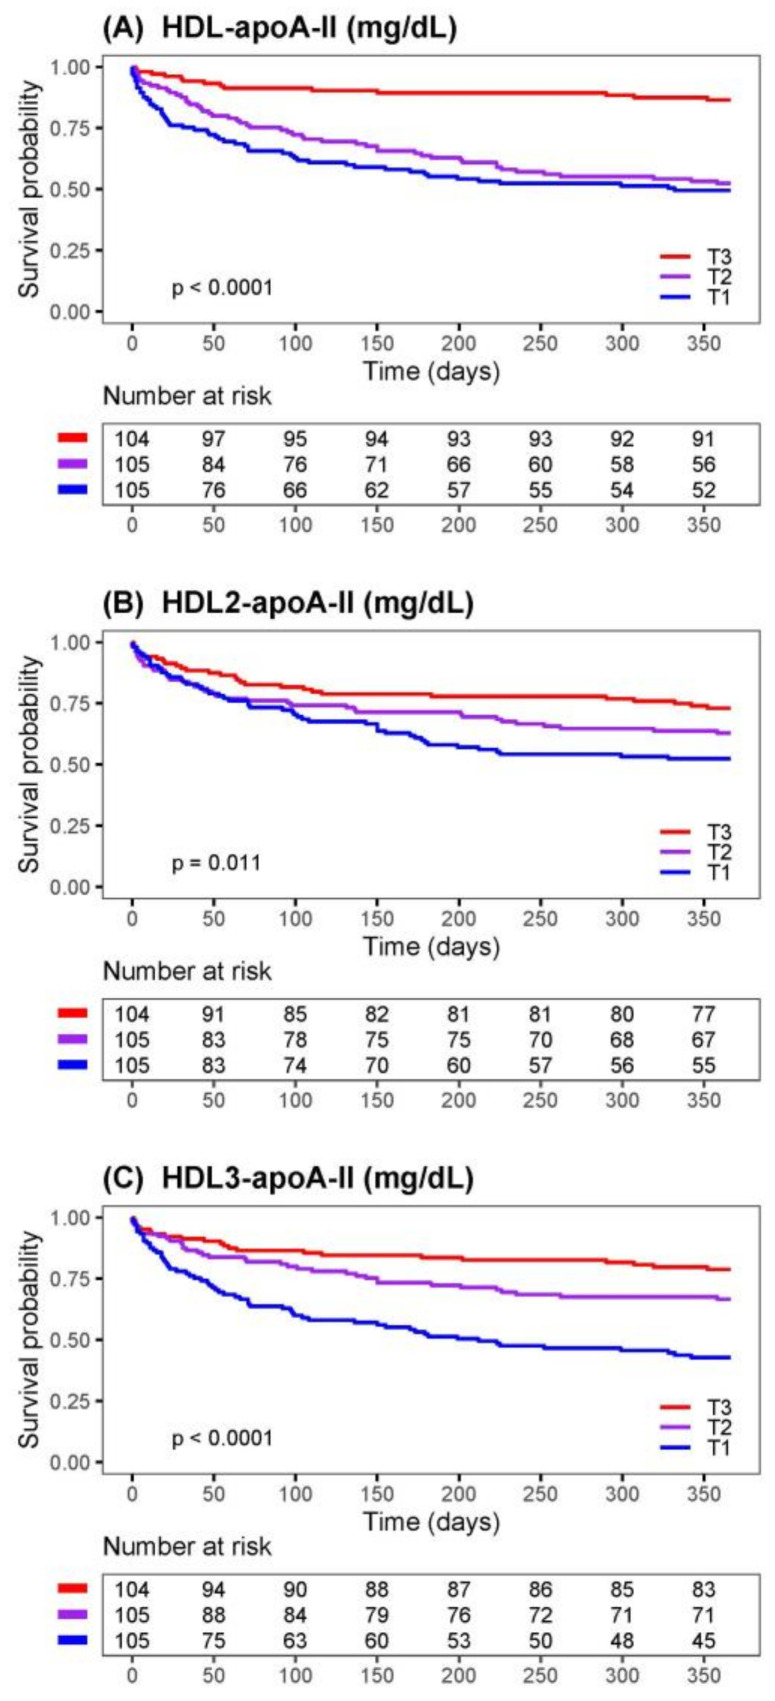
Figure 1.
Risk of 1-year mortality of AHF patients stratified by tertiles of HDL parameters. Kaplan–Meier survival curves for 1-year mortality of AHF patients comparing tertiles of (A) HDL-apoA-II, (B) HDL2-apo-AII, and (C) HDL3-apoA-II. The number of patients at risk at each time point is presented below the graphs. The limits of the tertiles (T) in mg/dL: HDL-apoA-II (T1 = 7.84–21.67, T2 = 21.67–27.02, T3 = 27.02–49.23); HDL2-apoAII (T1 = 1.30–2.81, T2 = 2.81–3.55, T3 = 3.55–7.70); HDL3-apoA-II (T1 = 1.15–4.17, T2 = 4.17–5.55, T3 = 5.55–13.55).

