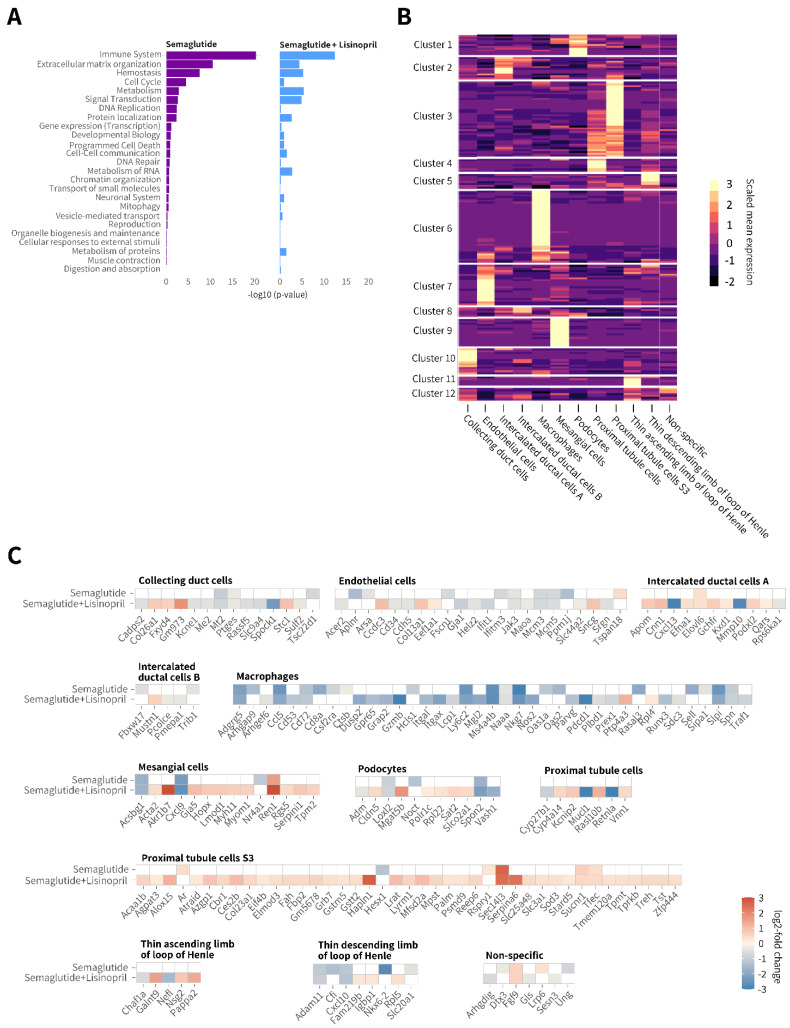
Figure 7.
Semaglutide suppresses gene expression markers of extracellular matrix remodelling and immune system activation in db/db UNx-ReninAAV mice. (A) Enriched Reactome pathways following semaglutide (30 nmol/kg, s.c., q.d. n = 7) and semaglutide (30 nmol/kg, s.c., q.d.) + lisinopril (30 mg/kg, p.o., n = 7) treatment compared to corresponding vehicle-dosed db/db UNx-ReninAAV mice (n = 7). (B) Deconvolution of differentially expressed genes (DEGs) according to major kidney cell type. Bright yellow color in heatmap denotes cluster of genes expressed with relative high cell specificity. (C) Heatmaps illustrating expression changes in individual DEGs grouped according to major cell type expressing the corresponding gene. Data are expressed relative to vehicle-dosed controls. Color gradients indicate significantly upregulated (red color) or downregulated (blue color) gene expression (log2-fold change, false discovery rate (FDR) < 0.05). All DEGs are listed in Table S1. Bulk RNA sequencing data are accessible using a web-based global gene expression data view-er [Gubra Gene Expression Experience (GGEX), https://rnaseq.gubra.dk/, accessed on 3 July 2022].

