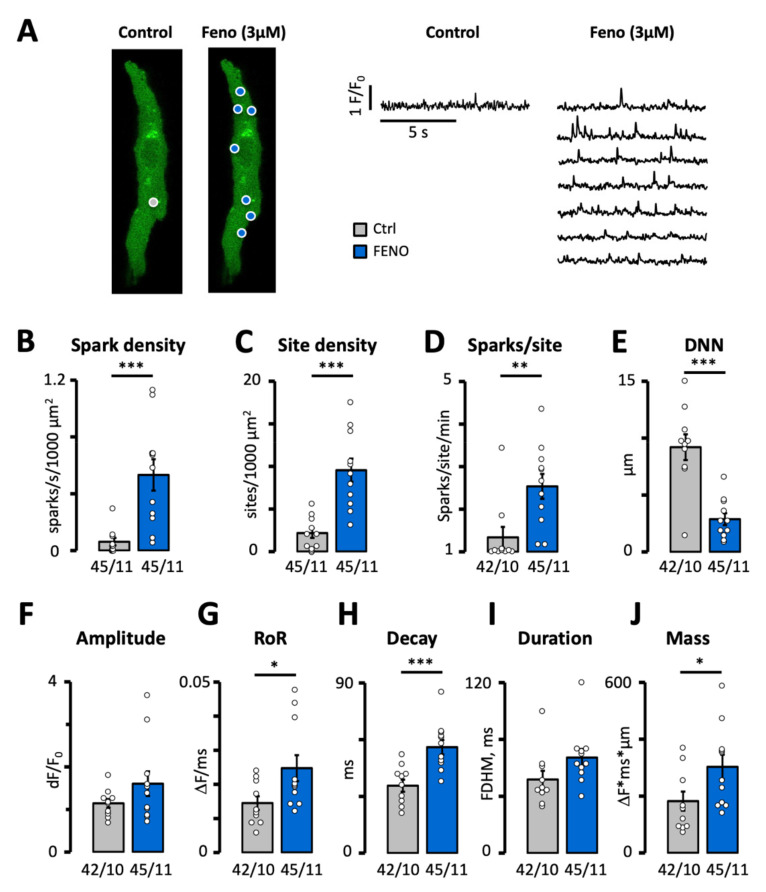
Figure 1.
Effect of fenoterol on calcium spark frequency and properties. (A) Calcium spark recordings in a patient before and after exposure to 3 µM Feno. Spark sites are marked with circles and the signal for each site is shown on the right. Impact of Feno on (B) spark density, (C) spark site density, (D) spark frequency per site. p-values in B–D were obtained using Wilcoxon rank sum exact test. (E) Distance to nearest neighbor (DNN). (F) Spark amplitude. (G) Rate of rise (RoR). (H) Decay time constant. (I) Full duration at half maximum (FDHM). (J) Spark mass. p-values in E–J were obtained using Student’s t-test. Statistically significant differences between pairs of bars are indicated with *: p < 0.05, **: p < 0.01; ***: p < 0.001. Circles in (B–J) correspond with the values of individual data points. Number of cells/number of patients is given below bars.

