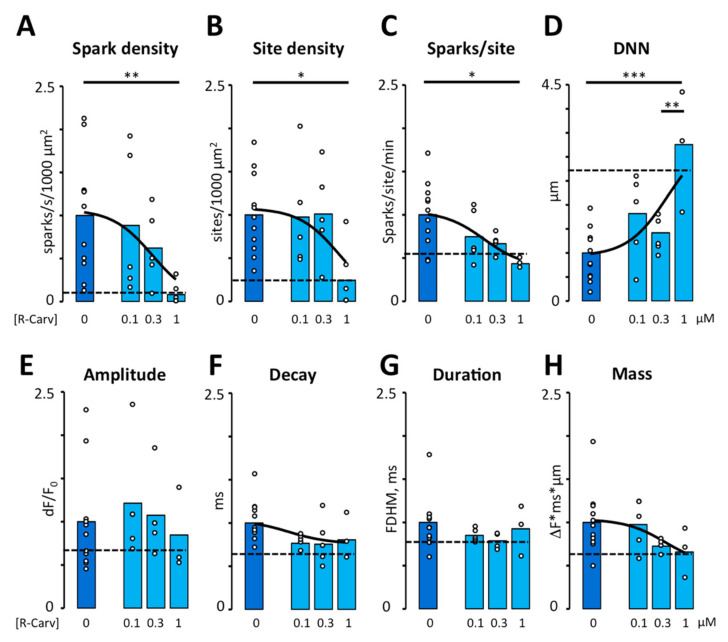
Figure 3.
Effect of R-Carvedilol on calcium spark frequency and properties. Calcium spark frequency and properties were recorded in myocytes after addition of Feno and increasing doses of R-Carv (given below bars). (A) Spark density. (B) Spark site density. (C) Spark frequency per site. p-values in A–C were obtained using Kruskal–Wallis test followed by Bonferroni-adjusted multiple comparisons. (D) Distance to nearest neighbor (DNN). (E) Spark amplitude. (F) Decay time constant. (G) Full duration at half maximum (FDHM). (H) Spark mass. Data are from 45 cells/11 patients. p-values in D–H were obtained using ANOVA test followed by Tukey’s multiple comparisons test. Statistically significant differences between pairs of bars are indicated with *: p < 0.05, **: p < 0.01; ***: p < 0.001. Solid lines represent fitting using a Hill equation. Dashed lines represent mean values recorded in control conditions before exposure to Feno. Circles in (A–H) correspond with the values of individual data points.

