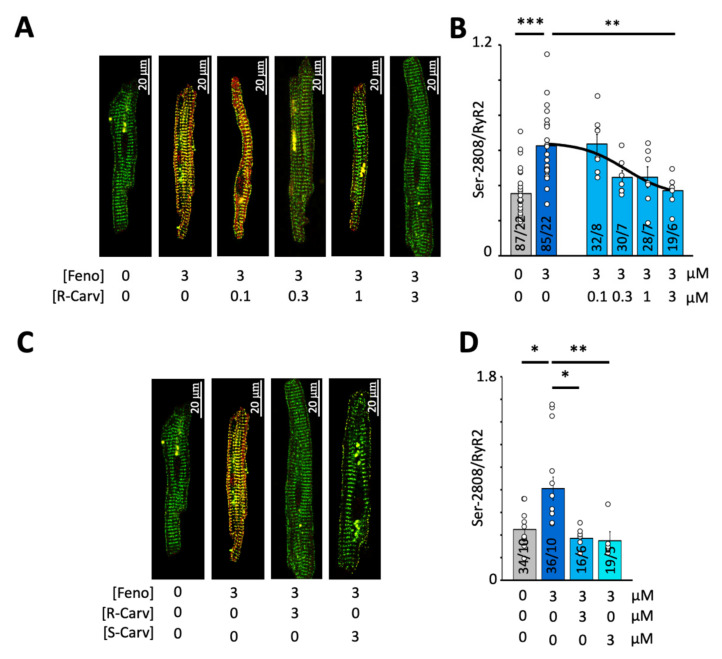
Figure 5.
Effect of R- or S-Carvedilol on RyR2 phosphorylation at Ser-2808. (A) Overlay of total RyR2 (green) and Ser-2808-phosphorylated RyR2 (red) for different R-Carv concentrations (given below images). (B) Mean RyR2 phosphorylation at Ser-2808 determined as the fluorescence intensity ratio (Ser-2808/RyR2). (C) Overlay of total RyR2 (green) and Ser-2808-phosphorylated RyR2 (red) for 3 µM R- and S-Carv. (D) Mean RyR2 phosphorylation at Ser-2808 determined as the fluorescence intensity ratio (Ser-2808/RyR2). The number of cells/number of patients is given for each bar. Statistical significance was determined using a one-way ANOVA followed by Tukey’s multiple comparison test. Statistically significant differences between pairs of bars are indicated with *: p < 0.05, **: p < 0.01; ***: p < 0.001. Circles in (B,D) correspond with the values of individual data points. Number of patients is given for each bar.

