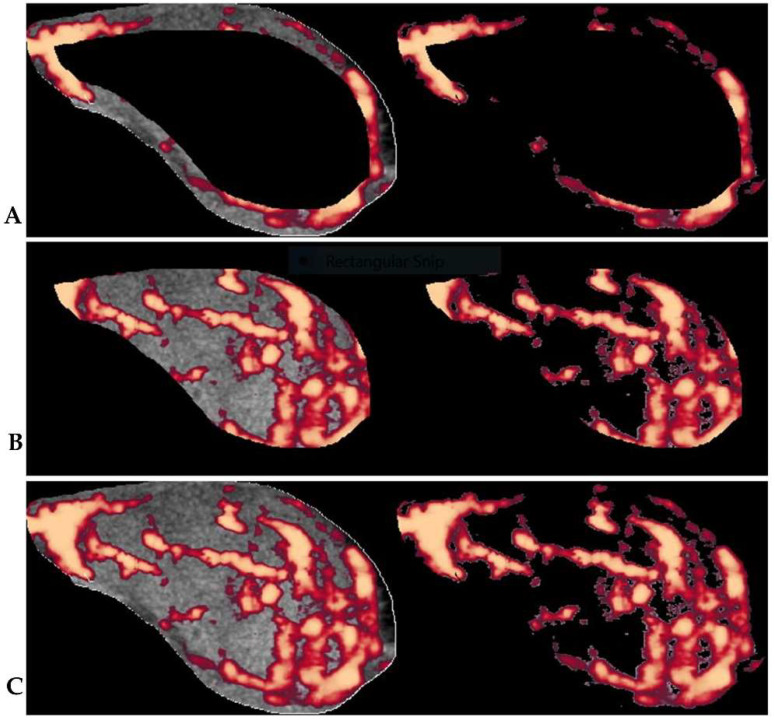
Figure 4.
The illustration of the segmentation of thyroid nodule vascularity into: (A) peripheral and (B) central regions. (C) shows the primary ROI from which the overall vascularity is calculated. The VI for the different segments is calculated by the algorithm as the percentage between the total number of pixels (left) and the number of colour pixels without the grey scale pixels (right) within the segmented areas. The RVI is the ratio of the VIs of peripheral regions to that of central regions.

