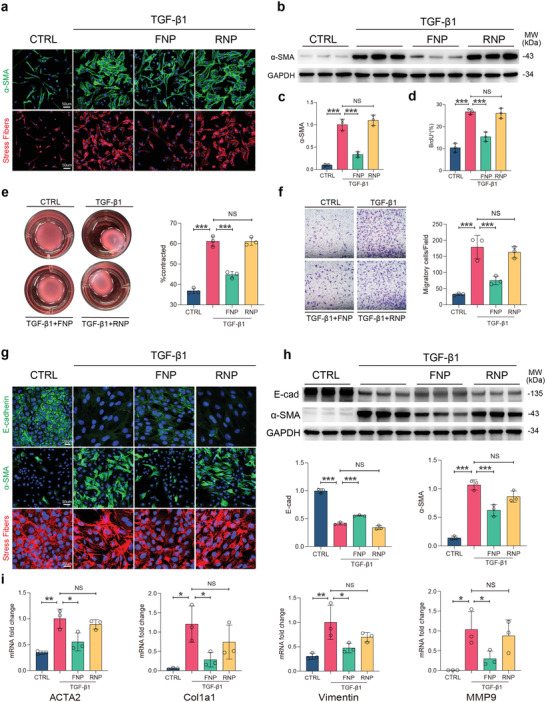
Figure 2.

FNPs attenuate TGF‐β1‐induced myofibroblast differentiation. a–d,f) Mouse primary lung fibroblasts were incubated with TGF‐β1 (5 ng mL−1), FNPs, RNPs or without stimulation (CTRL) for 24 h (n = 3 biologically independent samples). (a) Representative immunofluorescent images showing α‐SMA and stress fibers, nuclei were labeled with DAPI. (b,c) Western blot images and quantification of α‐SMA expression (normalized to GAPDH). (d) Percentage of BrdU positive cells using BrdU incorporation assays. e) Mouse primary lung fibroblasts were seeded in collagen gel and incubated with TGF‐β1 (5 ng mL−1), FNPs, RNPs or without stimulation (CTRL) for 48 h and the area of contraction was quantified (n = 3 biologically independent samples). (f) Representative migratory images and quantification of mouse primary lung fibroblasts by Transwell assay after 24 h of migration. g–i) NMuMG cells were incubated with TGF‐β1 (5 ng mL−1), FNPs, RNPs or without stimulation (CTRL) for 24 h (n = 3 biologically independent samples). (g) Representative immunofluorescent images showing E‐cadherin, α‐SMA, and stress fibers, nucleus were labeled with DAPI. (h) Western blot images and quantification (normalized to GAPDH) of E‐cadherin and α‐SMA expression. (i) Relative mRNA expressions (normalized to GAPDH) of ACTA2, Col1a1, vimentin, and MMP9. The data are expressed as mean ± s.d. Data were analyzed by one‐way ANOVA with Tukey's post hoc test, NS indicates not significant, *p < 0.05, **p < 0.01, ***p < 0.001.
