Figure 3.

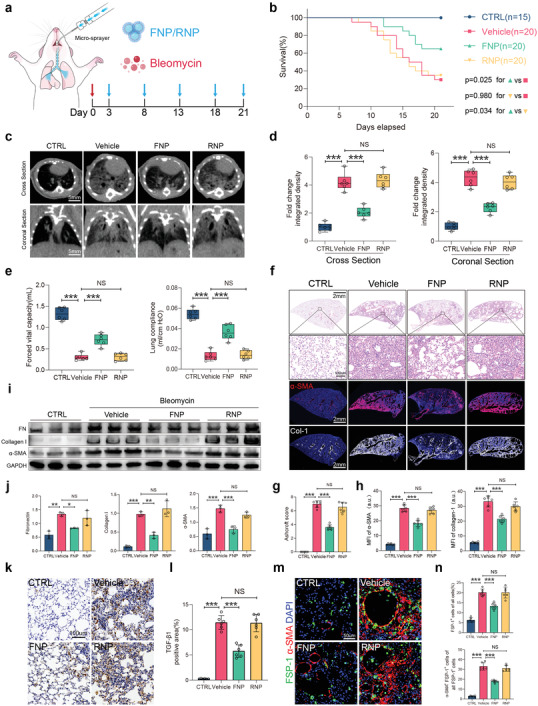
Intratracheal administration of FNPs attenuates bleomycin‐induced lung fibrosis. a) Experimental scheme of bleomycin‐treated mice administered with FNPs, RNPs (50 µL at 2 mg mL−1) or vehicle. b) Percent survival during 21 days of treatment after bleomycin injury. c) Representative cross‐section and coronal sections of lung micro‐CT images on day 21. d) Quantification of lung fibrosis severity by the integrated intensity of CT images (n = 6 biologically independent mice per group). e) Forced vital capacity and lung compliance was measured on day 21. f) Representative H&E staining and immunofluorescence staining of α‐SMA, collagen I from different treatment groups. g) Ashcroft scores evaluated from H&E staining (n = 6 biologically independent mice per group. h) Quantification of MFI of α‐SMA and collagen I (n = 6 biologically independent mice per group). i) Western blot analysis and quantification j) of fibronectin, collagen I, and α‐SMA expression from bleomycin‐induced fibrotic lungs of different treatment groups (n = 3 biologically independent mice per group). k) Representative immunohistochemistry staining of TGF‐β1 and l) percentage of TGF‐β1 positive area from different treatment groups (n = 6 biologically independent mice per group). m) Representative immunofluorescence staining of FSP‐1 (green) and α‐SMA (red), nuclei were labeled with DAPI. n) Percentage of cells that was FSP1+ (top) and percentage of FSP1+ cells that was α‐SMA+ (bottom) for each group. (g,h,j,l,n) Data are expressed as mean ± s.d. (d,e) Data are presented as box‐and‐whisker plots. Survival distributions were estimated by the Kaplan–Meier method and compared by the log‐rank test. Data were analyzed by one‐way ANOVA with Tukey's post hoc test, NS indicates not significant, *p < 0.05, **p < 0.01, ***p < 0.001.
