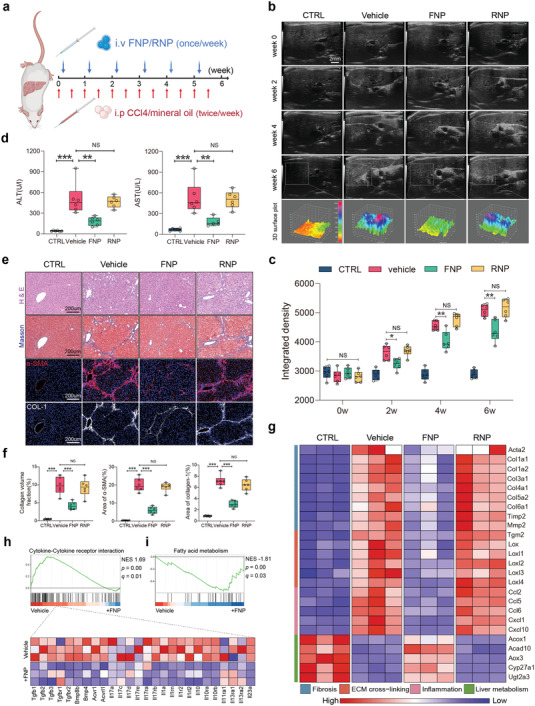
Figure 4.

Intravenous administration of FNPs attenuates CCl4‐induced liver fibrosis. a) Schematic representation of CCl4‐induced liver fibrosis and treatment timelines for FNPs, RNPs (100 µL at 2 mg mL−1) or vehicle. b) Representative ultrasound images of mice livers from different treatment groups before and 2, 4, and 6 weeks after the initiation of CCl4 injections. The 3D surface plots within the gray squares correspond to the echogenic intensity and uniformity in the liver. c) Quantification of liver fibrosis severity by integrated intensity of ultrasound images (n = 6 biologically independent mice per groups). d) Serum liver function tests of mice from different treatment groups (n = 6 biologically independent mice per groups). e) Representative H&E staining, Masson's trichrome staining, and immunofluorescence staining of α‐SMA, collagen I from different treatment groups. f) Quantification of collagen volume fraction from Masson's trichrome staining and area% of α‐SMA and collagen I (n = 6 biologically independent mice per groups). g) Heat map of profibrotic, proinflammatory, ECM cross‐linking‐related and liver metabolism‐related gene expressions. h,i) GSEA for indicated MSigDB‐defined gene clusters. Data are presented as box‐and‐whisker plots. Data were analyzed by one‐way ANOVA with Tukey's post hoc test, NS indicates not significant, *p < 0.05, **p < 0.01, ***p < 0.001.
