
Figure 6.
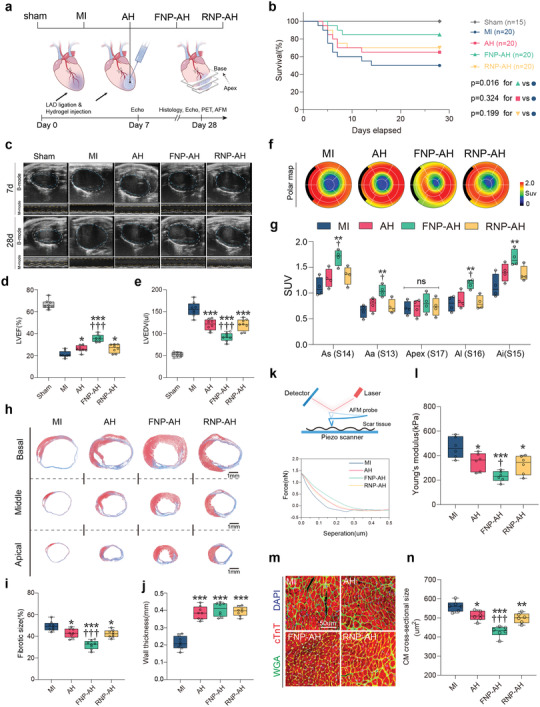
FNP‐AH improves cardiac function, reduces fibrotic area, and limits adverse cardiac remodeling after MI. a) Schematic representation of the study design. b) Percent survival during 28 days after MI. c) Representative echocardiography images on day 7 and day 28. d) LVEF and e) LVEDV assessed by echocardiography on day 28 (n = 8 biologically independent mice per group). f) Representative 17‐segment polar map via 18F‐FDG PET imaging on day 28. g) Quantification of SUV of 18F‐FDG via PET imaging (n = 4 biologically independent mice per group). As, apical septal; Aa, apical anterior; Al, apical lateral; Ai, apical inferior. h) Representative Masson's trichrome staining on day 28. i) Quantification of fibrotic size and j) wall thickness based on the Masson's trichrome staining (n = 8 biologically independent mice per group). k–l) Measurement of the Young's modulus of scar tissue by AFM indentation. (k) Schematic representation of AFM indentation (top) and representative force curve graphic (bottom). (l) Quantification of Young's modulus for each group (n = 6 biologically independent mice per group). m) Representative immunostaining of wheat germ agglutinin (WGA), cardiac troponin T (cTnT), and DAPI to visualize the cross‐section of cardiomyocytes in the infract border zone. n) Quantification of cross‐sectional area of cardiomyocytes based on the WGA staining (n = 6 biologically independent mice per group). Data are presented as box‐and‐whisker plots. Survival distributions were estimated by the Kaplan–Meier method and compared by the log‐rank test. Data were analyzed by one way ANOVA with Tukey's post hoc test, *p < 0.05, **p < 0.01, ***p < 0.001 compare to the MI group, ††p < 0.01, †††p < 0.001 compare to the AH group.