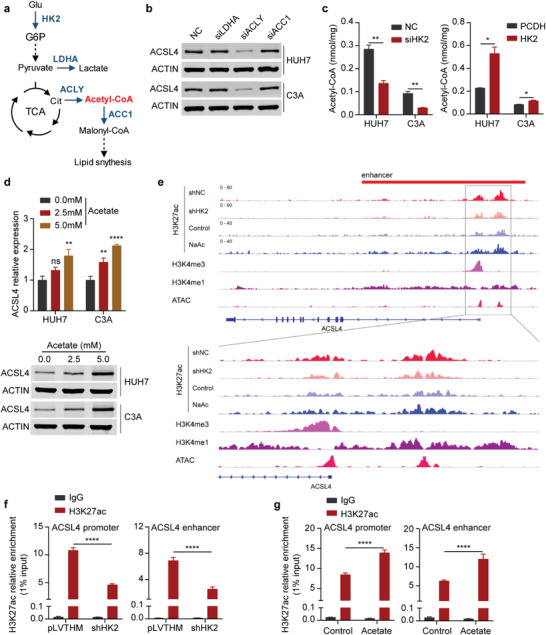
Figure 5.

Acetyl‐CoA accumulation by HK2 facilitates the enhancer and transcriptional activity of ACSL4. a) Schematic diagram shows the relationship of glycolysis, the TCA cycle, and the fatty acid synthetic process. b) Western blots measuring ACSL4 protein levels in HUH7 (up) and C3A (down) cells transfected with NC, LDHA, ACLY, and ACC1 siRNAs. ACTIN was detected as a loading control. c) Measuring the amount of acetyl‐CoA in HUH7 and C3A cells after transfection with HK2 knockdown (left) or HK2 overexpression (right). Data are represented as the mean ± SD (n = 3). One‐way ANOVA with multiple comparisons correction. d) Upper: Real‐time qPCR showing ACSL4 mRNA expression (relative to ACTB) in HUH7 and C3A cells after treatment with acetate as indicated above. Data are represented as the mean ± SD (n = 3). One‐way ANOVA with multiple comparisons correction. Down: Western blot measuring ACSL4 protein levels in HUH7 and C3A cells after treatment with acetate as indicated above. ACTIN was detected as a loading control. e) ChIP‐seq assays showing the H3K27ac peak at the promoter and enhancer regions of ACSL4 in the negative control (shNC) and HK2 knockdown (shHK2) cells or control and acetate‐treated cells. The peaks of H3K4me3 and H3K4me1 represent the promoter and enhancer regions, respectively. f) ChIP‐PCR showing H3K27ac enrichment (relative to 1% input) at the ACSL4 promoter (left) and enhancer (right) regions in HUH7 cells after HK2 knockdown. Data are represented as the mean ± SD (n = 3). Two‐way ANOVA with multiple comparisons correction. g) ChIP‐PCR showing H3K27ac enrichment (relative to 1% input) at the ACSL4 promoter (left) and enhancer (right) regions in HUH7 cells after treatment with acetate (5 × 10⁻³ m). Data are represented as the mean ± SD (n = 3). Two‐way ANOVA with multiple comparisons correction. *p < 0.05, **p < 0.01, ***p < 0.001, ****p < 0.0001.
