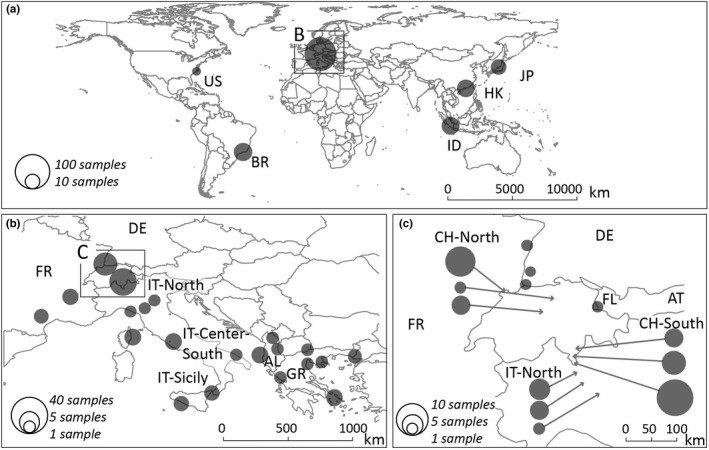
FIGURE 1.

Aedes albopictus sampling sites. The pie charts represent collection sites, where the size of each pie represents how many individuals were collected in each location. The panels represent the sampling sites at the (a) global, (b) Europe, and (c) Swiss levels.
