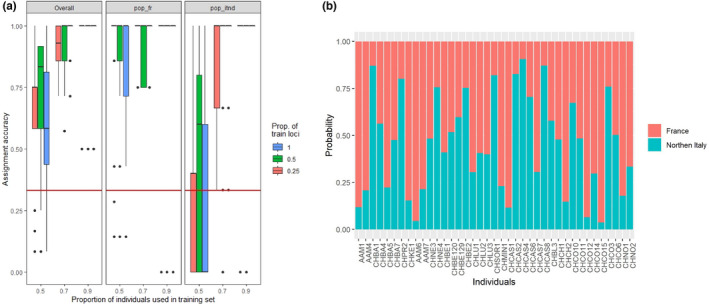
FIGURE 9.

Genetic assignment tests. (a) Assignment accuracy estimated by Monte Carlo cross‐validation based on the 2. europe_cleaned dataset. Assigned source populations were France (pop_fr) and Northern Italy (pop_itnd). Red horizontal lines indicate 0.33 null assignment rate, where the assignment accuracy is zero. (b) Membership probability of the individuals collected in Switzerland, organized from north to south. Individuals are sorted based on the probability of assignment to their original populations.
