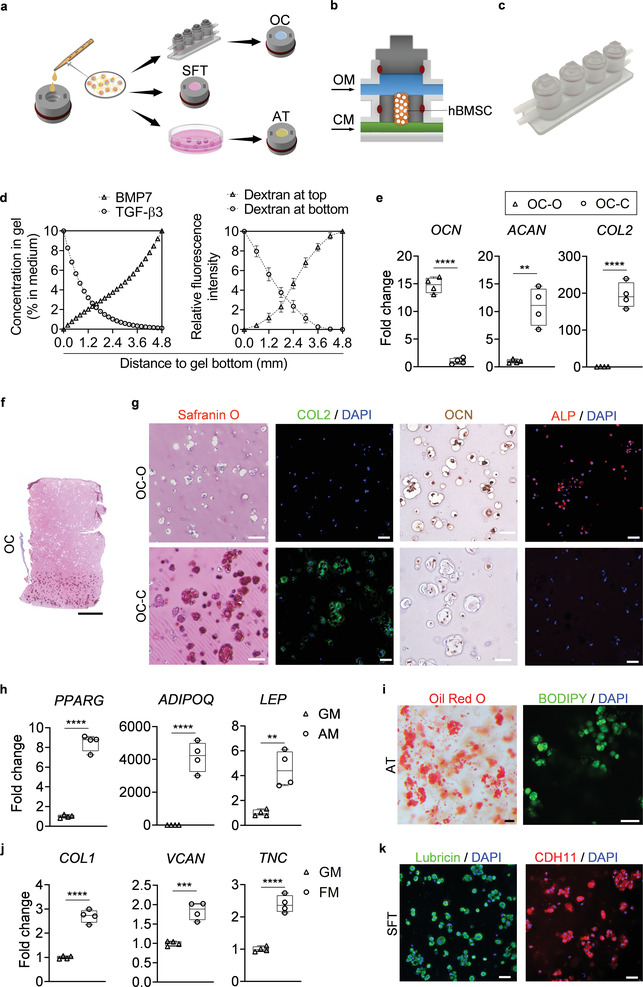
Figure 2.

Engineering and characterization of individual miniJoint tissue components. a) Experimental schematic showing the fabrication of different miniJoint tissue components. OC, osteochondral tissue; SFT, synovial‐like fibrous tissue; AT, adipose tissue. b,c) A dual‐flow chip, allowing perfusion of osteogenic medium (OM) above the MSC‐laden gel insert and chondrogenic medium (CM) below the gel insert b), was 3D printed c) and used to generate the biphasic OC microtissues. d) Simulated and measured biomolecule diffusion within the osteochondral tissue. Assuming a partitioning coefficient of 0.1, equilibrated distribution profile of BMP7, an osteogenic growth factor in OM, and TGFβ3, a chondrogenic growth factor in CM, in the OC microtissue was calculated (left). For validation purposes, dextran (molecular weight, 20 kDa) labeled with fluorescein isothiocyanate was added to either the top or bottom stream of a dual‐flow bioreactor to simulate the diffusion of BMP7 and TGFβ3, respectively (right). The relative fluorescence intensity was normalized and set in the range of 0–10. N = 4 for the dextran diffusion test. e) Box plots showing the expression of OCN, COL2, and ACAN in the bone (OC‐O) and cartilage (OC‐C) components of the OC microtissues. OCN data were normalized to values in OC‐C, and COL2 and ACAN data to values in OC‐O. Data were analyzed by the Student's t‐test (N = 4 biological replicates). **, p < 0.01; ****, p < 0.0001. f) Safranin O staining of the entire OC unit. Scale bar = 1 mm. g) Safranin O staining and immunostaining images showing prominent GAGs (Safranin O) and COL2 presence (immunostaining) in OC‐C, and OCN and ALP (immunostaining) in OC‐O. Scale bar = 50 µm. h) Box plots showing the expression of peroxisome proliferator‐activated receptor gamma (PPARG), adiponectin (ADPOQ), and leptin (LEP) in AT microtissues. Data were analyzed by the Student's t‐test (N = 4 biological replicates). ***, p < 0.001; ****, p < 0.0001. GM, growth medium; AM, adipogenic medium. i) Oil Red O and BODIPY staining images showing deposition of lipid droplets in the AT microtissue. Scale bar = 50 µm. j) Box plots showing the expression of COL1, VCAN, and TNC in SFT microtissues. Data were analyzed by the Student's t‐test (N = 4 biological replicates). ***, p < 0.001; ****, p < 0.0001. FM, fibrogenic medium. k) Immunostaining of lubricin and CDH11 for the FT. Scale bar = 50 µm.
