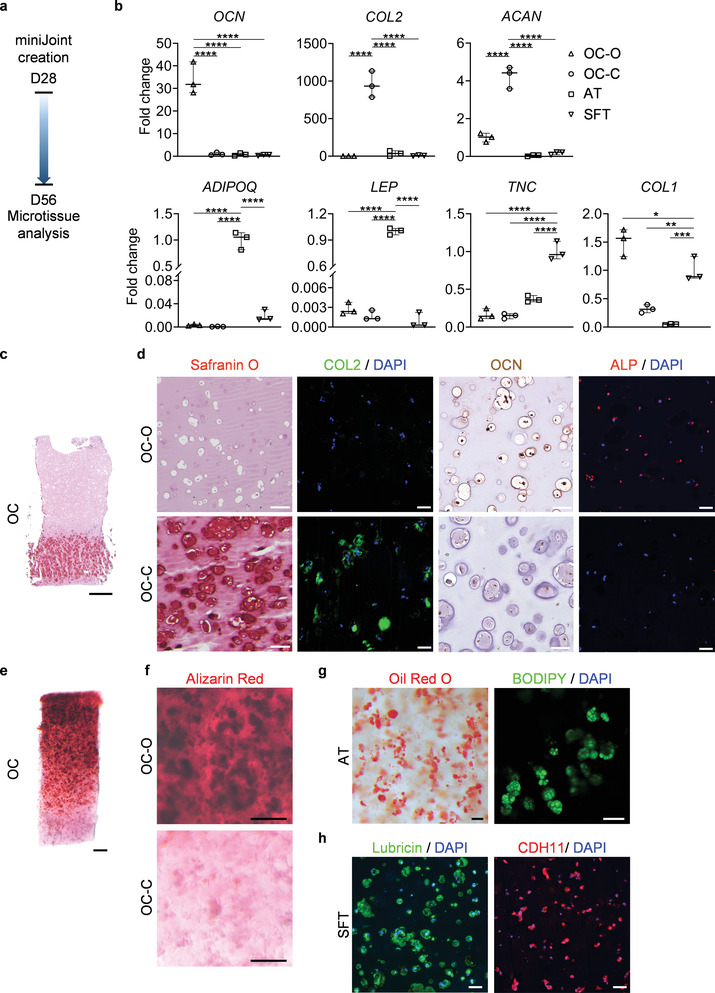
Figure 3.

The microtissues maintained their individual tissue phenotypes after four weeks of co‐culture in the miniJoint chip. a) Timeline of generating a normal miniJoint chip with tissue‐specific phenotypes maintained. b) Box plots showing the expression of key marker genes in all four tissue components. OCN data were normalized to those in OC‐C, COL2, and ACAN data to values in OC‐O, ADIPOQ and LEP data to values in AT, and TNC and COL1 data to values in SFT. Data were analyzed by one‐way ANOVA (N = 3 biological replicates). *, p < 0.05; **, p < 0.01; ***, p < 0.001; ****, p < 0.0001. c) Safranin O staining of the biphasic OC unit. Scale bar = 1 mm. d) Histological staining and immunostaining images confirming the presence of bone‐ and cartilage‐specific markers in the corresponding component of the OC unit. Scale bar = 50 µm. e) Alizarin Red staining of the OC unit showing the presence of calcium deposits primarily in the OC‐O. Scale bar = 500 µm. f) Magnified views of the Alizarin Red staining image in e). Scale bar = 200 µm. g) Oil Red O and BODIPY staining images showing the retention of lipid droplets in AT. Scale bar = 50 µm. h) Immunostaining images showing the expression of lubricin and CDH11 by the synovial‐like fibrous tissue (SFT). Scale bar = 50 µm.
