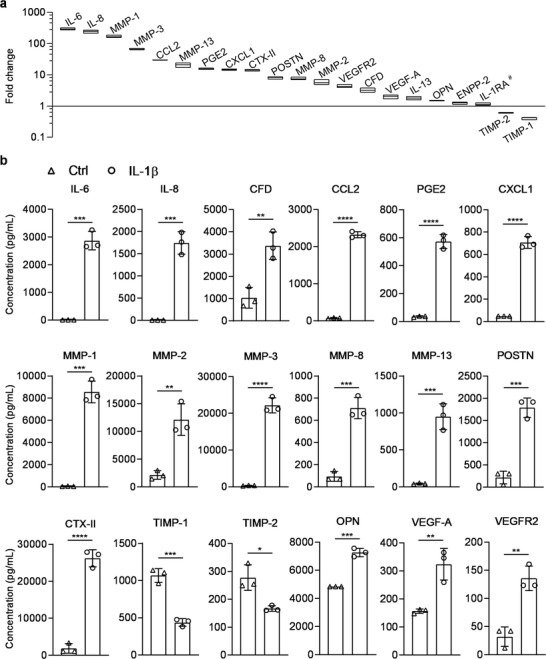
Figure 5.

Levels of selected inflammation and degeneration markers in the SM collected from untreated (Ctrl) or inflamed (IL‐1β) miniJoint. a) Fold change in the concentrations of selected markers present in SM from the inflamed (IL‐1β) miniJoint, normalized to the levels of corresponding markers in SM from the Ctrl group (i.e., values for the Ctrl group were set at 1). Markers with # showed no statistical difference in concentration between the inflamed miniJoint and the untreated control (p ≥ 0.05). All others without # indicated statistical difference (p < 0.05). Data were analyzed by the Student's t‐test (N = 3 biological replicates). The box limits indicate the minimum and maximum values, with the line inside denoting the median. b) The concentrations of selected molecules in the SM collected from Ctrl and inflamed miniJoint chips. Data were analyzed by the Student's t‐test (N = 3 biological replicates). *, p < 0.05; **, p < 0.01; ***, p < 0.001; ****, p < 0.0001. SM, shared medium.
