Figure 7.

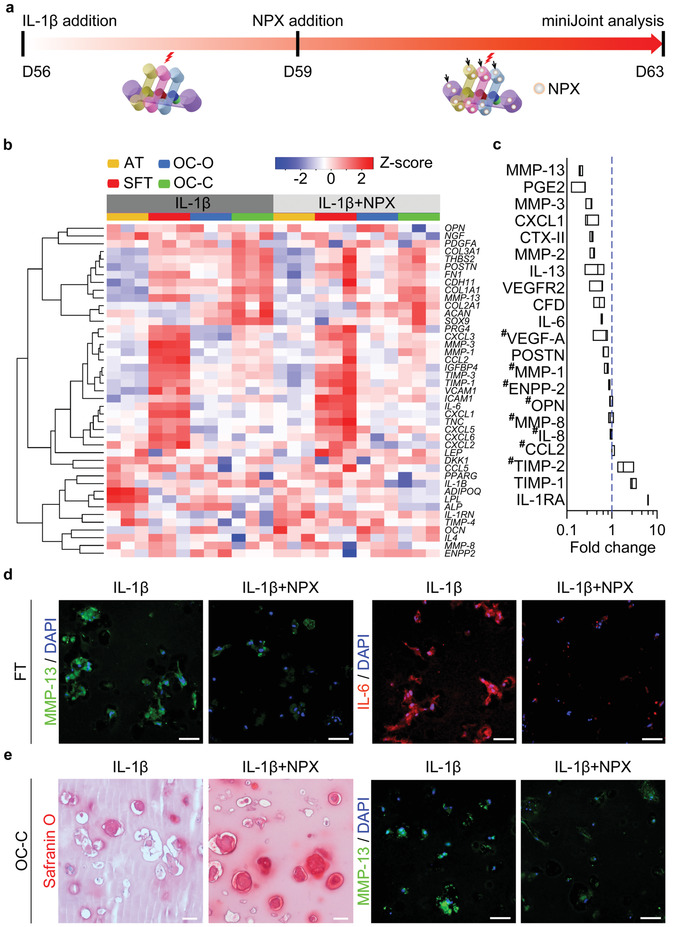
Testing the “therapeutic efficacy” of naproxen (NPX) in the inflamed miniJoint. a) Schematic and timeline of “systemic” administration of NPX in miniJoint (analogous to enteral/parenteral administration in vivo). NPX was added to all the medium streams (indicated by black arrows) after 3 days of IL‐1β treatment of the SFT tissue. b) Heat map generated from RNA‐Seq showing the relative expression of selected marker genes in all four tissues. c) Levels of selected biomarkers in SM, collected from inflamed miniJoint without (IL‐1β) or with NPX treatment (IL‐1β+NPX). The concentration of each marker was normalized to that in the non‐NPX‐treated IL‐1β group, with # indicating no statistical difference between the two groups (p ≥ 0.05). Data were analyzed by the Student's t‐test (N = 3 biological replicates). The box limits indicate the minimum and maximum values, with the line inside denoting the median. d) Immunostaining images showing reduced levels of MMP‐13 and IL‐6 in the SFT microtissue after NPX treatment. Scale bar = 50 µm. e) Safranin O staining and immunostaining showing more GAG retention and lower MMP‐13 level in OC‐C, respectively, after NPX treatment. Scale bar = 50 µm.
