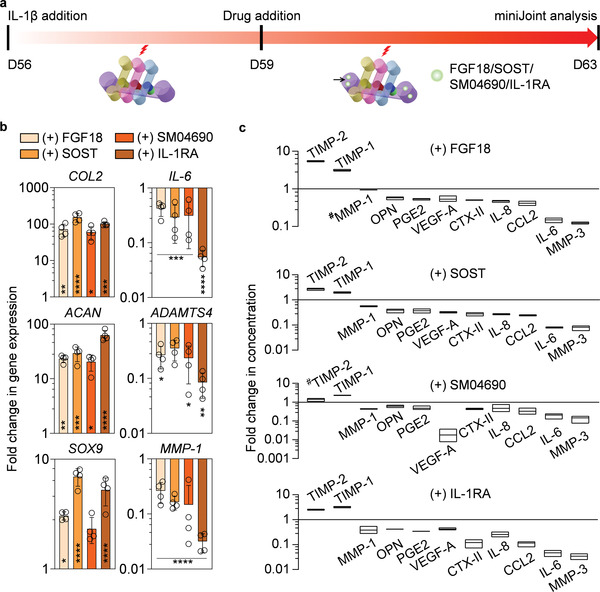
Figure 8.

Evaluating four potential DMOADs via “intraarticular administration” in the inflamed miniJoint. a) Schematic and timeline of intraarticular administration of drugs. Each drug was added to the shared medium stream (indicted by black arrow) after 3 days of IL‐1β treatment of the SFT tissue. b) Gene expression in OC‐C after 4 days of drug treatment. Gene expression data were normalized to those of the nondrug‐treated group. Data were analyzed by the Student's t‐test (N = 4 biological replicates). Statistical differences between each drug‐treated group and the nondrug‐treated group are indicated by *, p < 0.05; **, p < 0.01; ***, p < 0.001; and ****, p < 0.0001. N = 4 biological replicates. SOX9: SRY‐Box Transcription Factor 9. c) Levels of selected biomarkers in SM, collected from inflamed miniJoint without or with 4 days of FGF18, SOST, SM04690, or IL‐1RA treatment. The concentration of each marker was normalized to that in the nondrug‐treated group, with # indicating no statistical difference in marker concentration between the two groups (p ≥ 0.05). All others without # indicated statistical difference (p < 0.05). Data were analyzed by the Student's t‐test (N = 3 biological replicates). The box limits indicate the minimum and maximum values, with the line inside denoting the median.
