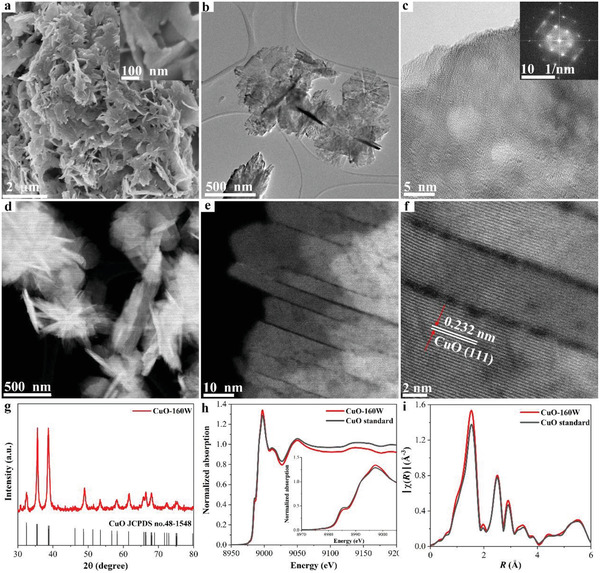
Figure 2.

Structural characterization of CuO nanosheets. a) SEM image, b) TEM image, c) high‐resolution TEM image and corresponding FFT pattern, d) HAADF‐STEM image, e,f) high‐resolution STEM image, g) XRD pattern, h) Cu K‐edge XANES spectrum, and i) Cu K‐edge Fourier transformed EXAFS spectrum.
